SKYW - Value And Momentum Breakout View: Cyclical Rally Faces A February Reckoning
Summary
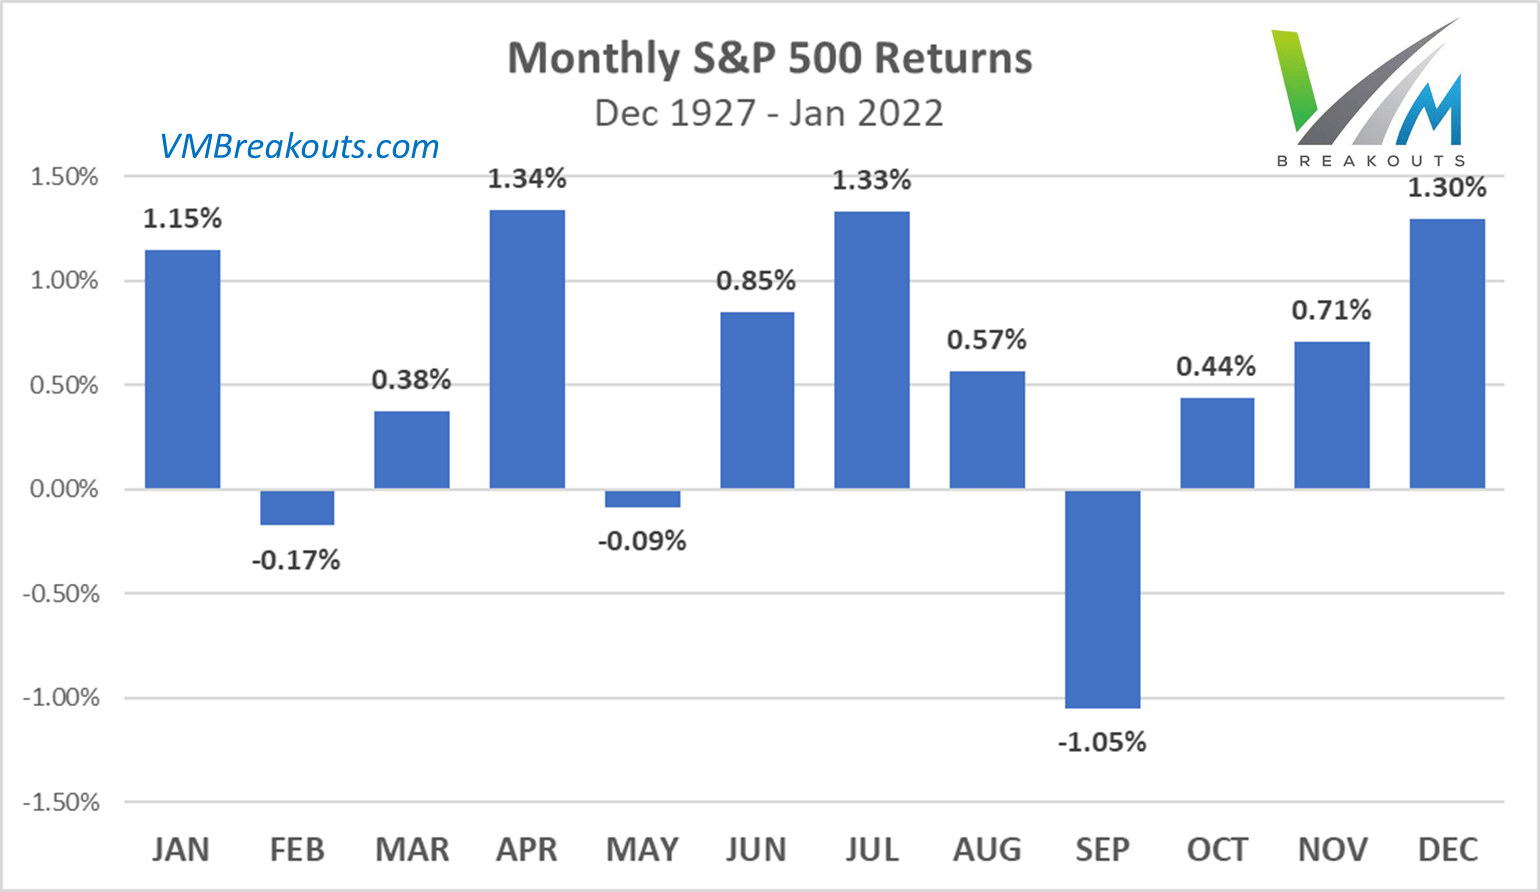
- Since 1927, the S&P 500 in January averages one of the most positive months of the year. February averages the 2nd most negative month.
- The Fed has reiterated in December and the minutes released in January that at least three more rate hikes are planned for 2023 starting at the Feb 1st FOMC meeting.
- What does the road ahead look like for sectors and markets?
Introduction
Although our intellect always longs for clarity and certainty, our nature often finds uncertainty fascinating. ~ Carl von Clausewitz.
My long term outlook for 2023 is detailed in my submission to Seeking Alpha's 2023 Market Prediction contest. I offer readers an overly precise conviction that the S&P 500 Index (SP500) will end the year at 3,240.76 with tremendous volatility and trading opportunity. Some readers say my forecast "has the most substance" and seems "the most realistic" of anything they have read about 2023. Whatever may happen, it is still unknown to me and I have never won a Powerball pick.
This shorter breakout view article provides a close up about where we are and what may happen next on the S&P 500's ( SPX , SPY ) road to 3,240.76.
February Historically Has Delivered Negative Returns
Historically, the S&P 500 experiences a January effect or Santa Claus rally with increasing gains from October through January. There are always exceptions and last year delivered the worst January start to the year since 1939. However, whether January begins positively or negatively, February delivers average negative returns over the past 95+ years.
By now, everyone who has access to social media or can view a sketch on a napkin has seen the bearish S&P 500 pattern following the negative channel from 2021. Most realize that the two largest catalysts of the stock rally from 2020 have been removed and severely impaired going into 2023. Namely, The Fed is tightening and corporations are reducing their record buybacks.
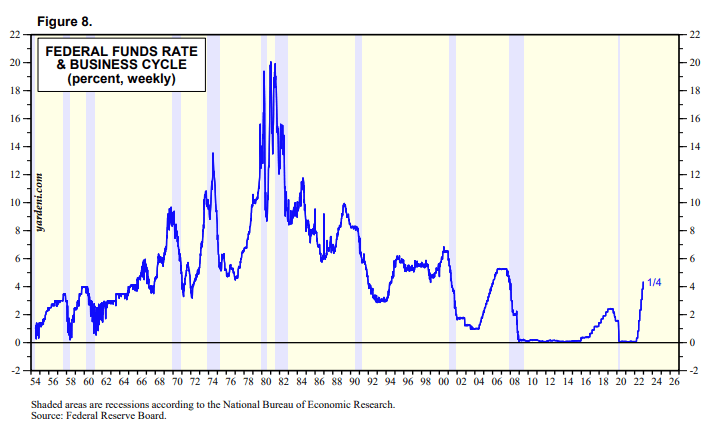
The Fed has shifted to the highest and fastest rate hikes in U.S. history away from a very stimulative position from March 23rd, 2020 at the start of QE 4 to March 9th 2022 the end of QE 4. Not only has the Fed begun draining its own assets from markets, but it has begun to impair massive corporate buybacks by pushing rates to the highest levels since 2008.
This pattern on the weekly SPY chart back to September of last year shows just how much volatility increases when we transition from a Fed program of quantitative easing to a program of quantitative tightening. As liquidity is drained from the markets we increasingly see volatility increasing. This is totally consistent with what I tracked and forecasted from the last QT period in 2018.
VMBreakouts.com FinViz.com
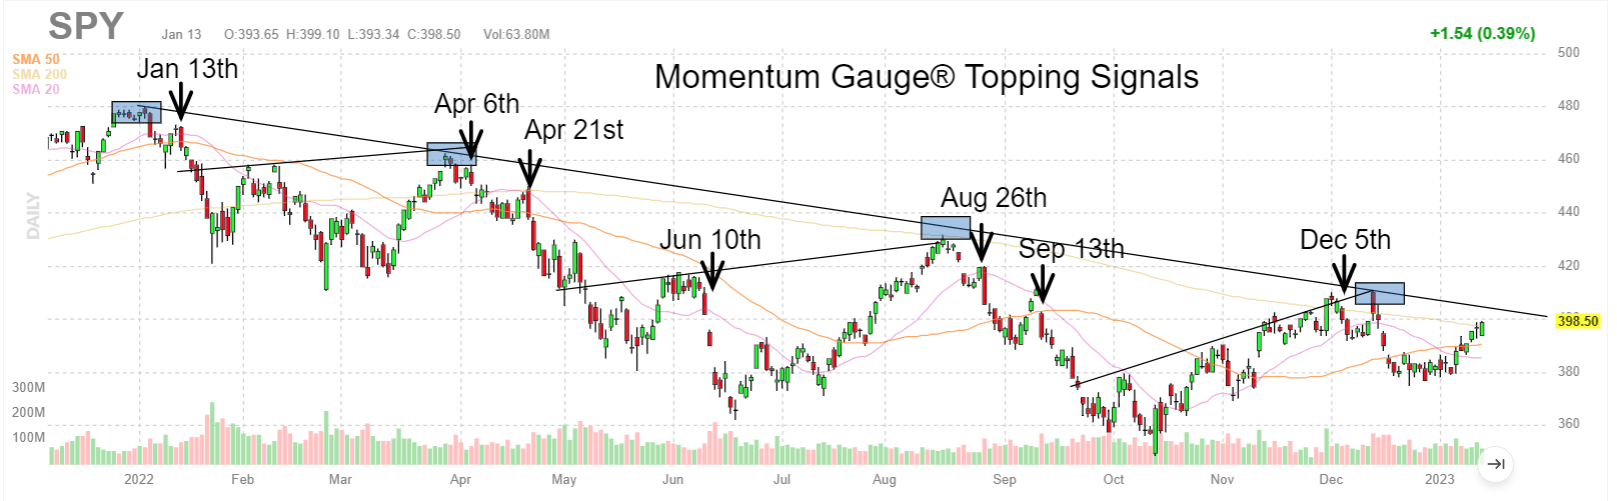
I would not be the least bit surprised to see the next market pullback correspond with an ongoing test of 4000 or the 4180 December highs right before the February rate hike. Currently, the positive Momentum Gauge values are at the highest levels since mid-August. This is roughly about two-weeks prior to the negative August signal.
Strategy for 2023
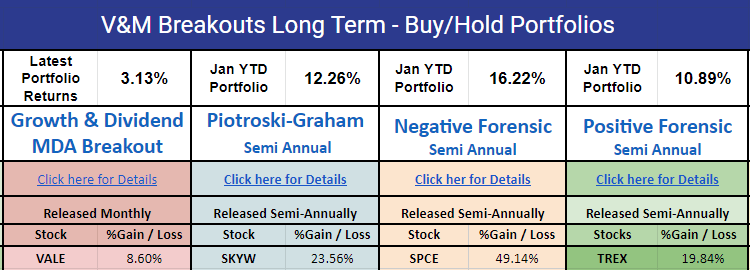
My broad strategy for 2023 is to stay bullish on China as the largest economy still in QE and stimulating their markets, while all other major economies are in QT fighting inflation. I plan to overweight US treasuries/bonds as explained in the 2023 technical forecast article while remaining cautious on U.S. stocks following the gauge signals. Lastly, I am seeing a strong shift to value that is setting records in my long-term value portfolios.
Vale S.A. ( VALE ) +8.60% is leading the Growth & Dividend MDA Breakout picks
SkyWest Inc. ( SKYW ) +23.5% is leading the Piotroski-Graham enhanced value picks
Virgin Galactic Holdings, Inc. ( SPCE ) +49.1% is leading the January Negative Forensic picks
Trex Company, Inc. ( TREX ) +19.8% is leading the January Positive Forensic picks
This trade adjustment is also effecting my ETF trading, and significant for the MDA breakout stock selections up +21.37% to start the new year.
ETF Trading Strategy
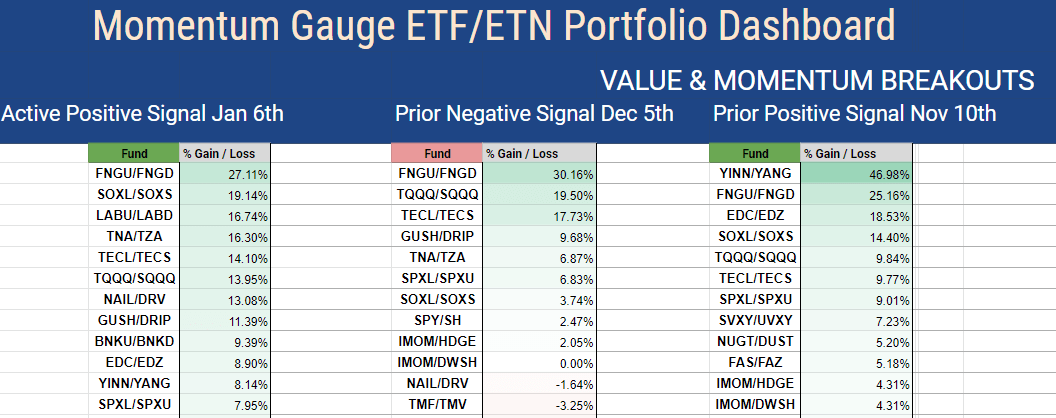
So far the Active ETF (exchange-traded fund) portfolio has captured gains in Direxion Daily CSI China Internet Bull 2X Shares ( CWEB ) +13.54% and Direxion Daily FTSE China Bull 3X Shares ( YINN ) +29.33% to start the year. The trade in US treasuries in the first two weeks has yielded +13.8% in Direxion Daily 20+ Year Treasury Bull 3X Shares ( TMF ) and I will expound more on the treasury trade in a later section. I expect these trades to do well through the year although these returns are well above expectations and not likely sustainable at this pace.
In the indexing portfolio that trades the Momentum Gauge signals in bull/bear combo funds the strongest returns are in ( FNGU ) +27.1%, ( SOXL ) +19.1% and ( LABU ) +16.7%. Investor risk appetite and momentum are generally strongest when technology and biotech sectors are leading the market as they are for the first time since November. This momentum could continue longer than most may expect as FOMO and meme-chasing create a sort of venturi effect that pulls in capital wherever large gains are reoccurring with some consistency.
However, just like the August signal last year, traders may quickly shift back to aggressive profit-taking and a market pullback, as such rapid gains are well above normal. Certainly, I do not expect my stock MDA breakout picks to sustain a 640% annualized return this year, honestly, not even close.
Mid-year 2023 is where things may get interesting with potential for an actual Fed pivot. Dip-buyers will continue to try to pull this anticipated pivot event forward in time extending high market volatility while the Fed hikes rates. Mid-year I also plan to leverage strong results from a new Russell Reconstitution anomaly we found last year that is actively tracked on the dashboard: FTSE Russell Reconstitution Anomaly Study - Strong +22.7% Difference After 5 Months.
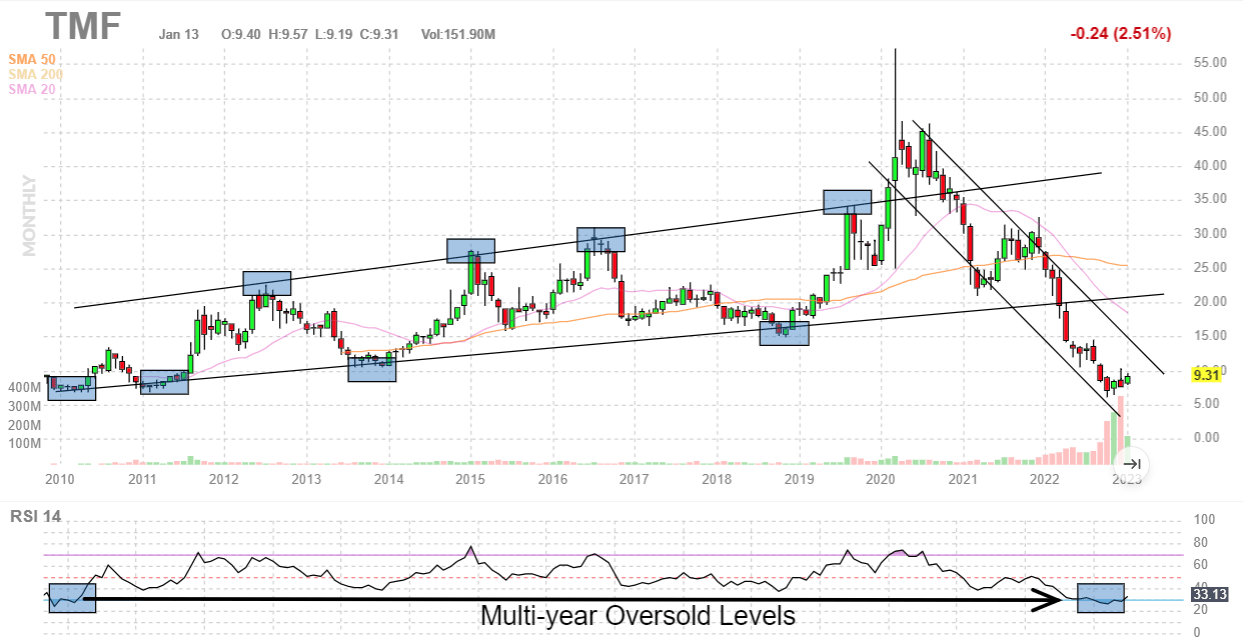
The U.S. Treasury Trade
For only the third time since 1926, both U.S. stocks and bonds lost money in 2022 (the other two occurrences were 1931 and 1969). ~ Goldman Sachs.
I expect that this combination of both stocks and bonds declining will not sustain through 2023. This leads me to believe that it will be bonds that break the pattern and outperform equities for three reasons:
1) Equity markets are still highly overvalued at over 17.5 times earnings based on multi-decade valuation ratios.
2) Bonds have suffered some of the worst one-year declines in more than 200 years.
BofA Global Investment Strategy
3) Interest rates are scheduled for at least three more rate hikes into 2023, according to the Fed statements in December. Higher rates greatly increases borrowing costs for corporations. Higher borrowing costs sharply reduces equity buybacks from the highest levels in U.S. history. Without trillions in corporate buybacks helping to prop up market prices we can expect similar market direction as 2008, 2018, and 2020 prior to Fed intervention.
Hopefully, we will not experience similar downside magnitudes.
Standard & Poor's Yardeni.com
Many technical indictors are at the most oversold levels since 2010. Bonds have strong potential to significantly outperform equities on a shift in risk/return decisions from large institutional managers evaluating the highest yields in decades. The timing for this move, however, may not occur until closer to midyear of 2023.
Conclusion
Watch the Q4 Earnings closely, especially for corporate guidance about 2023. While inflation appears to getting more under control in more economic segments, the recession trade and layoffs are adding to a new set of market stress. We have never had a period in U.S. history where a recession did not follow after more than a 4% increase in the Fed fund rate. Additionally, we are experiencing the fastest series of rate hikes ever undertaken by the Fed.
Watch for investors to move more toward value investing, longer-term horizons, and less concern about inflation and more concern about recession.
All the very best to you in the New Year! Stay safe and healthy and have a great week of trading!
JD Henning, PhD, MBA, CFE, CAMS.
For further details see:
Value And Momentum Breakout View: Cyclical Rally Faces A February Reckoning