VZ - Verizon And T-Mobile: Less Capital Intensive 5G
2023-04-21 01:52:32 ET
Summary
- In a period where monetary policy remains tight, it is important to assess how wireless operators like T-Mobile and Verizon are spending capital to build their networks.
- I confirm that Capex has likely peaked from four different sources, including a comparison with China, a look at towerCos' topline, and relevant corporate metrics.
- In this respect, topline results by Swedish equipment vendor Ericsson are particularly interesting.
- Lower Capex augurs well for the free cash flow, with valuations done accordingly.
- Still, I make sure to apply some moderation as operators' revenue growth remains anemic in view of competition and the market remains volatile.
There has been a lot of talk about the opportunities offered by 5G for integrated telecom operators like Verizon ( VZ ) and wireless service providers like T-Mobile (NASDAQ: TMUS ) which are investing billions of dollars in order to attract subscribers to their networks.
Comparison of Key Metrics (seekingalpha.com)
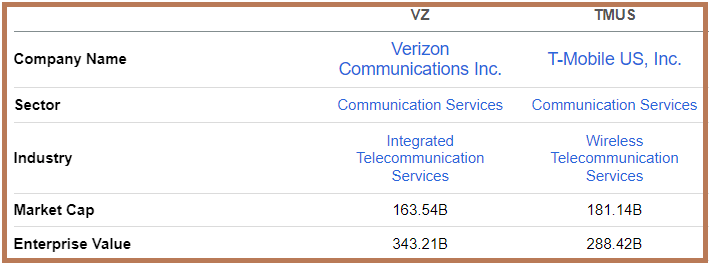
However, little research work actually elaborates on the amount invested and how this can impact both companies' finances as they report earnings next week, especially given that monetary policy is likely to remain tight for the foreseeable future as the Federal Reserve addresses the high inflation issue.
For this purpose, this thesis aims to show that capital intensity has likely peaked, and to make my point, I will use the sales results of RAN (radio access network) kit vendor Ericsson (NASDAQ: ERIC ), Capex metrics, data by tower companies, and a 5G deployment report by Viavi Solutions ( VIAV ) comparing the U.S. and China.
Another objective is to assess whether investments are bearing returns and to this end, a comparison with big tech proves useful.
Ericsson's Pains Bodes Well for U.S. Operators
As per the Swedish company's latest financial results, sales in North America including the U.S. declined by SEK 4 billion (around $387 million) as operators continued to restrain Capex spending, and at a faster pace. Furthermore, the topline should continue to be under pressure both in the second and third quarters as operators have large inventories to absorb.
Now, $387 million may seem a trivial amount but North American operators were early 5G adopters, with T-Mobile signing a multi-billion dollar contract with Ericsson and its competitor Nokia ( NOK ) for expanding its 5G RAN in September 2020. As for Verizon, it signed a deal worth around $6.6 billion with Ericsson in Jan 2021 as well as one with Samsung ( SSNLF ) for approximately the same amount.
These billions are reflected in both companies' quarterly capital expenditures as shown below.
Interestingly, the charts show Capex intensity to have peaked in the first half of 2021 as there were investments into antennae and related equipment, but also into spectrum acquired in the much-publicized FCC auctions .
Additionally, due to the Covid pandemic disrupting supply chains, operators have beefed up inventories, and as shown in the charts below, these still remain relatively high and have to be consumed before ordering new gear. Also, Ericsson's CEO does not expect a high growth rate in the Mobile Networks business in 2024, implying that 5G spending by operators has likely peaked. Here, investors will note that Verizon spends more both on Capex and inventories since as an integrated operator, it operates both fixed-line and cellular mobile networks, with a sizeable portion dedicated to 5G.
Confirming 5G Spend has Peaked
Pursuing further, investments in fifth-generation wireless having reached a peak is also supported by a report by Viavi, which specializes in network testing and measurement devices. It says that the U.S. now leads the world in 5G deployments. In this case, while China remains ahead in terms of the number of subscribers and speeds, the number of U.S. cities covered has now reached 503 compared to only 356 for the East Asian country whose total has remained the same since mid-2021.
The report further adds that the U.S. has known most of its growth in 2022, and, after investing both in frequency and equipment since 2021, American operators added a significant number of base stations and towers for the transmission and reception of 5G signals. Now, it is tower companies (towerCos) that typically invest in real estate (land and tower) which they then lease to operators. Thus, I checked the 4Q22 earnings for three of them, American Tower ( AMT ), Crown Castle ( CCI ), and SBA Communications Corporation (SBAC).
Interestingly, AMT revealed that around 50% of its sites are already 5G while CCI stated that around half of its sites for its top three customers have already been upgraded with 5G mid-band spectrum. For clarification purposes, compared to high-band which includes mmWave signaling, mid-band offers a better speed/coverage balance. This band includes the C-band utilized by Verizon to complete most of its first-phase deployments as part of its overall 5G expansion activities. As for T-Mobile, it has been rapidly expanding its 5G footprint since 2019 and was leading since early 2022 . Moreover, the completion of its merger with Sprint even resulted in a 3.5% churn rate.
Well, this does not mean that operators will discontinue making cell site investments to reach their nationwide coverage and capacity objectives. They will do so either by installing equipment in existing facilities or expanding to others, but, going ahead, they are likely to do so in a more composed manner.
Also, to expand into areas that make less economic sense they will surely avail the billions of dollars of government funding earmarked to bridge the digital divide between cities and disadvantaged communities staying in remote locations, instead of spending out of their own balance sheets.
Looking at Sales
Now, after spending so much money to build and later operate networks, there is a need for monetization. At this stage, it must be mentioned that both telcos (telecom operators) and MNOs (mobile network operators) are often compared with big techs like Alphabet (NASDAQ: GOOG ) and Meta Labs (META), which, by the way, also belong to the Communication Services sector.
These big techs also spend a lot of capital to generate revenues at a fast pace, and as a result, investors have rewarded them with market caps of trillions of dollars. However, Alphabet and Meta, which both belong to the Interactive Media and Services Industry differentiate themselves with their ability at building business models which are more vertically integrated on the very telecom infrastructures that operators spend so much to build.
Consequently, the next logical question is whether operators are being able to generate sufficient return on investments, in this case, revenues. One way to assess this is through the Capex-to-Sales metric which shows the investment made relative to the revenues generated. This is pictured for all four companies below.
Making sense of the above, after having invested 0.3x to 0.5x their sales generated in the 2021/2022 period as depicted in the pale blue and green charts, both Verizon and T-Mobile have now reduced capital intensity to the 0.195x to 0.217x range. This is within the 0.111x to 0.270x range of Google and Meta as shown by the deep blue and orange charts and, shows that the two operators have been able to achieve higher sales relative to the amount invested in building their networks. On top, this has been achieved against an unfavorable macroeconomic backdrop.
Anaemic Growth Compared to Big Tech
Looking specifically at Verizon, one of the reasons for generating more sales out of capital expenses is that the consumer remains in good shape as per its CFO. Also, thanks to the momentum build in H2-2022, the operator is seeing higher subscriber numbers despite hiking prices . Moreover, with strength in business wireless, FWA (Fixed Wireless Access), and private 5G, the company looks to meet its 2023 guidance when it announces results on April 25.
As for T-Mobile which announces results on April 27 , it has a better market positioning but had the lowest ARPA or Average Revenue Per Account, which also explains its lower EBIT (profit) margins as pictured below.
Comparison of Metrics (www.seekingalpha.com)
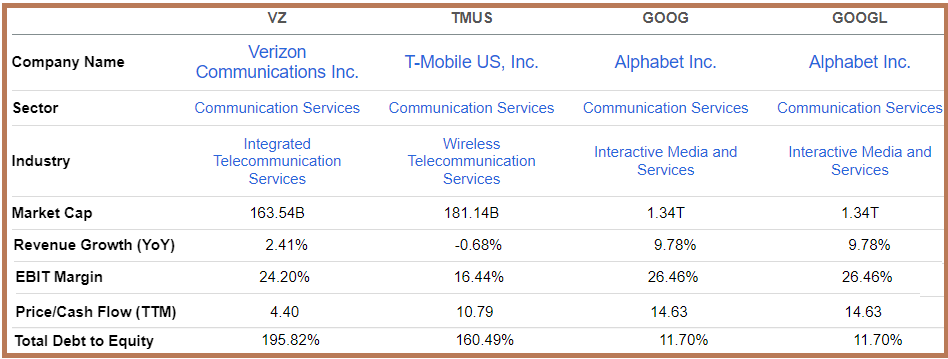
This means that it is also more likely to suffer from pricing pressures and the 5 million plus postpaid net customer additions guided for 2023 may have to be attained by sacrificing profits in favor of market share, just like Elon Musk's Tesla (NASDAQ: TSLA ).
Furthermore, as seen by operators' anemic revenue growth compared with big tech in the above table, making money is becoming more difficult as competition heats up, and subscribers look for deals. Thus, more emphasis will likely now be placed on service quality after prioritizing coverage, as well as branding ( Visible by Verizon and Mint Mobile by T-Mobile).
Using Cash for Valuing
However, while still spending for growth, Capex is not likely to see previous highs, which, augurs well for the FCF or free cash flow. Thus, after going negative as encircled in red in the 2020-2022 period, quarterly FCF figures should now increase in a more sustainable way.
Charting of the Quarterly Free Cash Flow (www.seekingalpha.com)
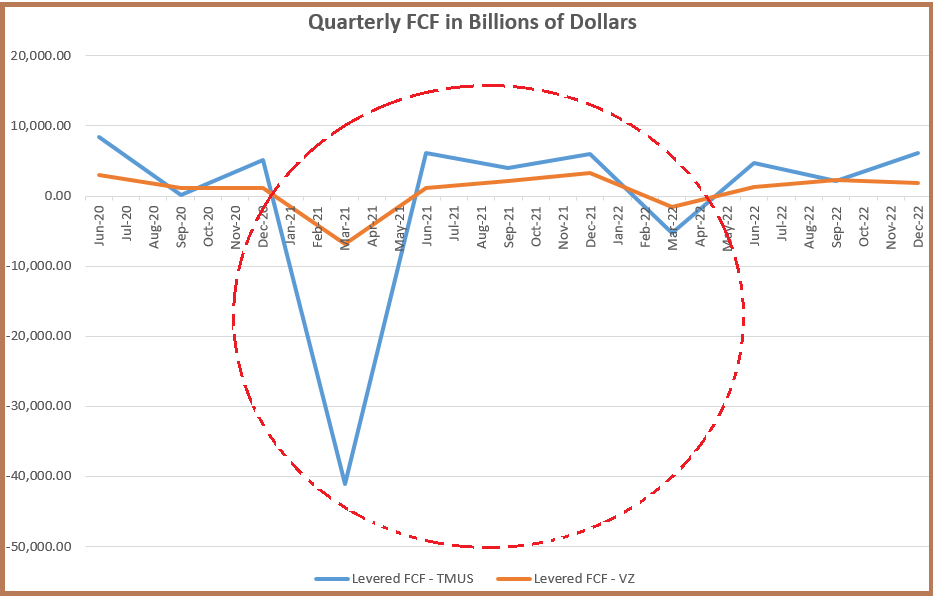
Of course, FCF also depends also on the amount of cash generated from operations after subtracting capital expenses, but, the peak in Capex being something of the past is a positive, especially when Debt-to-Equity exceeds the 100% mark for both.
In these circumstances, using the trailing Price-to-Cash flow metric for valuation purposes and replacing its multiple of 4.4x by 5x (which is less than half of T-Mobile's 10.79x as per the above table), I have a target of $43 (5/4.4 x 38.6) for Verizon, based on the current share price of $38.6. This is a conservative figure which remains below Wall Street ratings, but investors are cautioned that in case the company misses on analysts' estimates as was the case with AT&T ( T ) yesterday, the stock should be volatile . Still, for those who are ready to look past short-term volatility in the longer term, this is a stock to own as it also pays dividends.
As for T-Mobile, whose Price-to-Cash flow is already above 10x, it is important to assess how it signs more postpaid subscribers, without impacting profitability. In the meantime, I have a hold rating on the stock.
Conclusion
In conclusion, by showing that Capex has likely peaked, this thesis has shown that both T-Mobile and Verizon should see better free cash flow. Additionally, the higher amount of sales being squeezed out of the capital expenses as shown in the Capex-to-Revenue chart needs to be highlighted. At the same time, a comparison with big tech shows that it is better to adopt a dose of moderation when looking at the growth metric, in a stock market fraught with recession and stagflation (persistently high inflation) talks.
With its higher profitability and lower valuations, I am bullish on Verizon which can benefit from a 13.6% upside. As for T-Mobile, with 5G coverage having been extended nationwide, it is better to assess how it fares amid competition, namely in the way it balances subscriber growth with profitability.
For further details see:
Verizon And T-Mobile: Less Capital Intensive 5G