SPY - VTI: Hedged Or Unhedged A Good Choice For A Core Holding
2023-05-31 09:02:54 ET
Summary
- The Vanguard Total Stock Market Index Fund ETF offers investors broad exposure to the US stock market with a low 0.03% expense ratio and holdings in almost 3,900 stocks.
- VTI has an 11.87% average annual return over the last 10 years, with a majority of 1-year return periods producing positive results.
- Investors can create a long-term zero-cost hedge using LEAPS options for downside risk protection, while still capturing potential gains.
Sometimes the best course of action when trying to decide what sector to focus on is to just buy everything. The Vanguard Total Stock Market Index Fund ETF Shares ( VTI ) provides investors the opportunity to do just that in one low-cost fund. The fund comes with a very low 0.03% expense ratio and holds almost 3,900 stocks, seeking to track the CRSP U.S. Total Market index. You won't get any foreign companies as it is US-centric and while the top 10 concentration is fairly low at ~24% you still get a healthy dose of tech with the market capitalization weighting scheme. As shown in the following table, seven of the top 10 holdings are tech companies with Apple ( AAPL ), Microsoft ( MSFT ), and Amazon ( AMZN ) accounting for ~14% alone.
VTI Top 10 Holdings (Michael Thomas)
Given big tech has been a primary driver of market gains, this isn't necessarily a bad thing. If past performance is any indication of what the future holds, investors will need decent tech exposure to keep up with the market. There will be bubbles, such as what may be growing with AI, but VTI's broad market exposure provides some buffering against any single part of the market popping.
VTI ETF Analytics
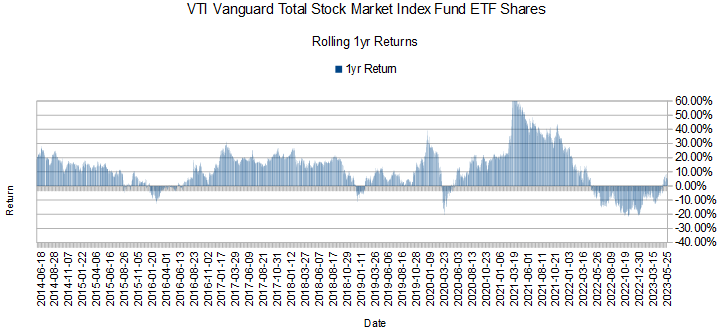
In terms of historical performance, it would've been a challenge for an investor to pick an entry point that would've produced a loss over any 1 year over the last 10 years. The following chart shows rolling 1-year annual returns for VTI over the last 10 years. Note that instead of using a single point of reference as most financial sites report, I use all 1-year periods within the last 10 years as reference points. I believe it gives a much better representation of what expected returns are for any given year.
The chart shows that over much of the last 10 years, annual returns have largely remained positive. The following table highlights return and risk data for VTI over the same period.
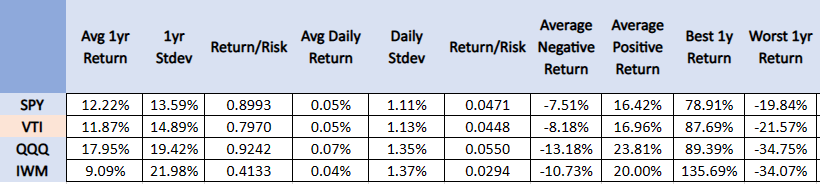
VTI Return vs Risk Analysis (Michael Thomas)
Over the last 10 years, VTI has an 11.87% average annual return with a standard deviation approaching 15%. This is on par with the S&P 500 benchmark SPDR S&P 500 ETF Trust ( SPY ) performance over the same period, underperforming slightly. The following graph shows how VTI stacks up against other major benchmark proxy ETFs.
As seen, the Invesco QQQ Trust ETF ( QQQ ) outperforms all other funds by a wide margin and the iShares Russell 2000 ETF ( IWM ) lags all other funds. It makes sense VTI comes in between these two ETFs in terms of performance given both constituent blocks are included in VTIs holdings.
The following table shows the distribution of returns for positive and negative outcomes along with better and worse-than-average outcomes.
VTI Outcome Distribution (Michael Thomas)
The data confirms largely what the prior 1-year rolling return chart already shows. The majority of the 1-year return periods produced at least positive results by almost 4:1 odds. Average returns are also slightly skewed positive occurring 52.38% of the time. Again, VTI comes in between QQQ and IWM as shown below.
ETF Outcome Distribution Comparison (Michael Thomas)
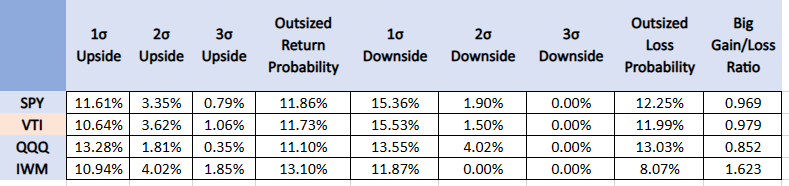
The next table shows the distribution of larger moves with 1, 2, and 3-sigma returns to get a measure of tail risk.
VTI Tail Risk Analysis (Michael Thomas)
Large 3-sigma returns skew entirely to the upside over 1-year return periods and 2-sigma moves also skew to the upside at almost 2:1 odds. More common occurrences of 1-sigma moves skew negative at roughly 3:2 odds and occur overall about 25% of the time. In terms of outsized gains or losses, VTI slightly outperforms both SPY and QQQ with a big gain/loss ratio of 0.979 outlined in the table below. Small-caps skew heavily in the positive with a big gain/loss ratio of 1.623 but as we'll see depend a lot more on timing than the other ETFs.
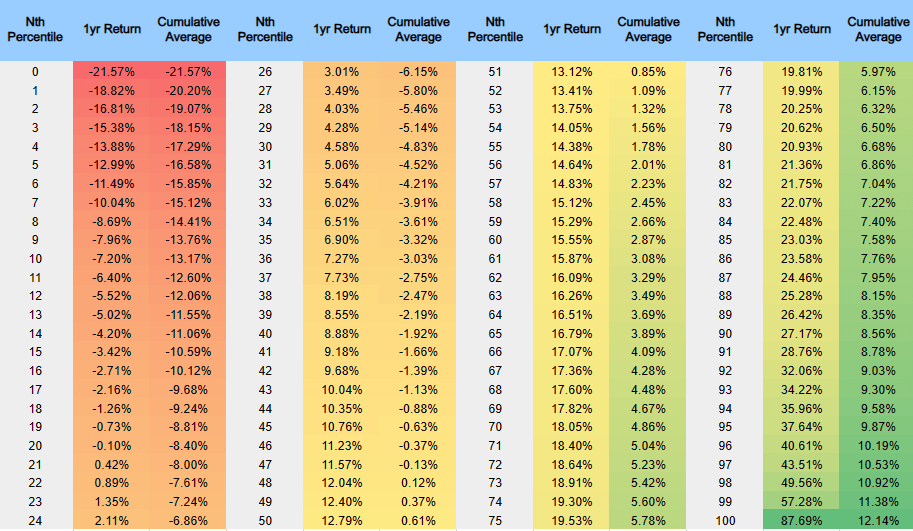
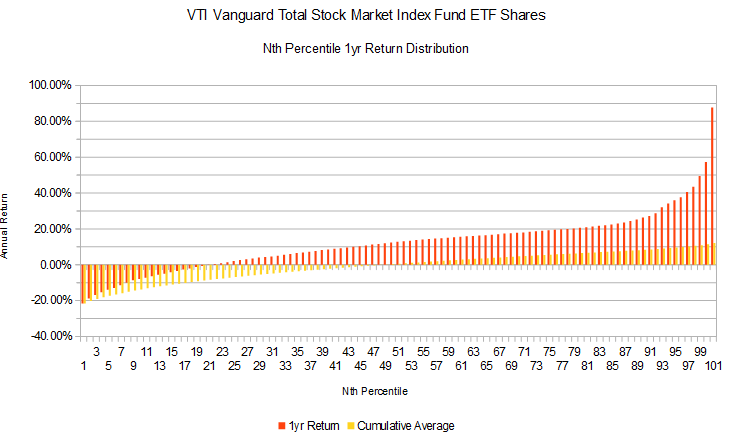
The percentile distribution of returns for VTI is given in the following table. The cumulative average column adds 1-year average returns starting at the 0th percentile and is used as a gauge of how much timing affects returns.
The median return, 50th percentile, is 12.78%. This is higher than the average return of 11.87% and is explained by the negative skew in 1-sigma returns over the reporting period. The cumulative average turns positive at the 48th percentile and compares favorably to other index ETFs as illustrated in the following table.
ETF Cumulative Average Comparison (Michael Thomas)
The high cumulative average of 77 confirms timing is a much more important factor in expected returns for IWM and compares more to what is seen in sector-specific ETFs. The following chart shows the relationship between return percentiles and the cumulative average for VTI.
VTI Returns Percentiles/Cumulative Average Relationship (Michael Thomas)
The next chart is perhaps the most important. It shows the relationship between 1-year returns, shown in blue, based on the prior 1-year return shown in red. Trendlines and corresponding formulas are also given.
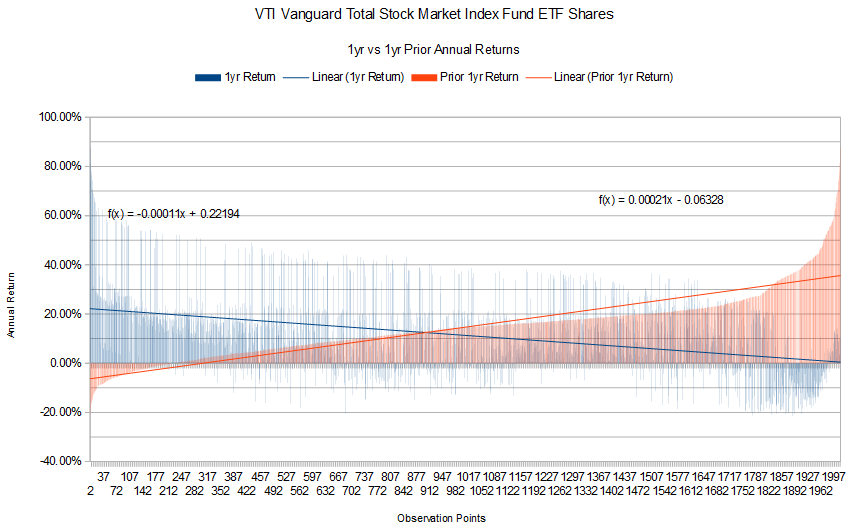
There is a clear inverse relationship between the 1-year and prior 1-year return data. It is noteworthy that the 1-year trendline remains positive throughout the entire chart and supports a strong positive return bias. With this chart and associated trendline formulas, we can calculate an expected future return based on the latest prior 1-year performance. With the last closing price of $208.36, VTI has a 1-year return of 4.44%. We can plug this into the prior 1-year trendline formula and solve for x,
.0444 = 0.00021x - 0.06328, yielding x = 512.76
We can then plug that into the trendline formula for 1-year return and solve for y,
y = -0.00011 (512.76) +0.22194, yielding y = .1655 or 16.55%
An expected return of 16.55% is above the average for VTI but below the 1-sigma upside.
Hedged Trade With LEAPS
One of the nicer features of VTI is that it comes with an options market that includes LEAPS. This allows the creation of a long-term zero-cost hedge by selling and covered call against owned shares and using the proceeds to buy downside protection in the form of a bear put spread. This is a strategy I use almost exclusively in accounts I am able.
The following example order shows the construction of the hedge with VTI trading at $208.50. A JAN 17 2025 235.00C covered call is sold while a JAN 17 2025 210.00/170.00P put spread is bought. Generally, these trades can be had close to the mid-price and you want to at least get breakeven. You may have to move a strike up or down.
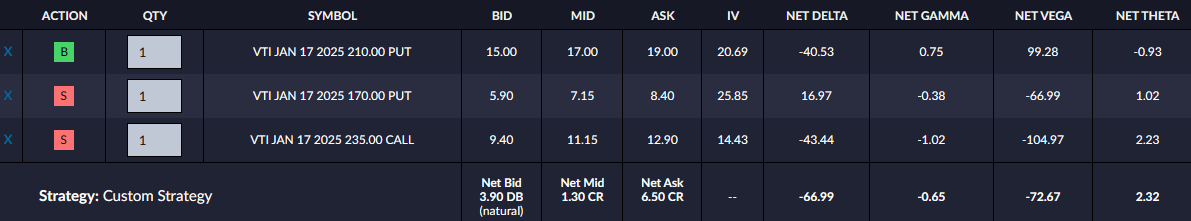
This setup will cap maximum price appreciation at 12.70%, or 7.55% annualized over ~1.6 years. In return, the first ~18.50% of losses are hedged. VTIs current dividend yield isn't huge at 1.57% but would bring the annualized return up to 9.12%. Strategic rolling of the short-put option could add another 1.42% to push the total annualized return up to 10.54%. This is below VTI's average return of 11.87% and also the calculated expected return of 16.55%. This may be an acceptable compromise to give up some gain potential for downside risk protection.
Takeaway
For those looking for broad-based exposure to the US total stock market, VTI offers a good choice. Given the historical performance and current trading levels, I would rate it a buy. Whether you buy the shares with or without a hedge is largely dependent on individual risk tolerance. For me, I have a hedged play on VTI that I entered into on 11/10/22 with a $194.88 cost basis on the shares and a JAN 17 2025 194.00/165.00P put spread with a 230.00C covered call.
For further details see:
VTI: Hedged Or Unhedged, A Good Choice For A Core Holding