SPY - VTI Or SPY? Why We Choose VTI
2023-04-24 18:59:56 ET
Summary
- Vanguard Total Stock Market ETF and SPDR S&P 500 Trust ETF are interchangeable under most circumstances.
- But not all circumstances.
- And we think now is an occasion where the differences are significant enough to matter.
- We will explain why VTI may have a more favorable return profile going forward due to its valuation compression compared to SPY.
- The results also point to a few actionable investing ideas.
Thesis
We assume the Vanguard Total Stock Market Index Fund ETF Shares ( VTI ) and SPDR S&P 500 ETF Trust ( SPY ) , as two of the most widely used funds broad market funds, need no introduction. Thus, we will directly get to the point.
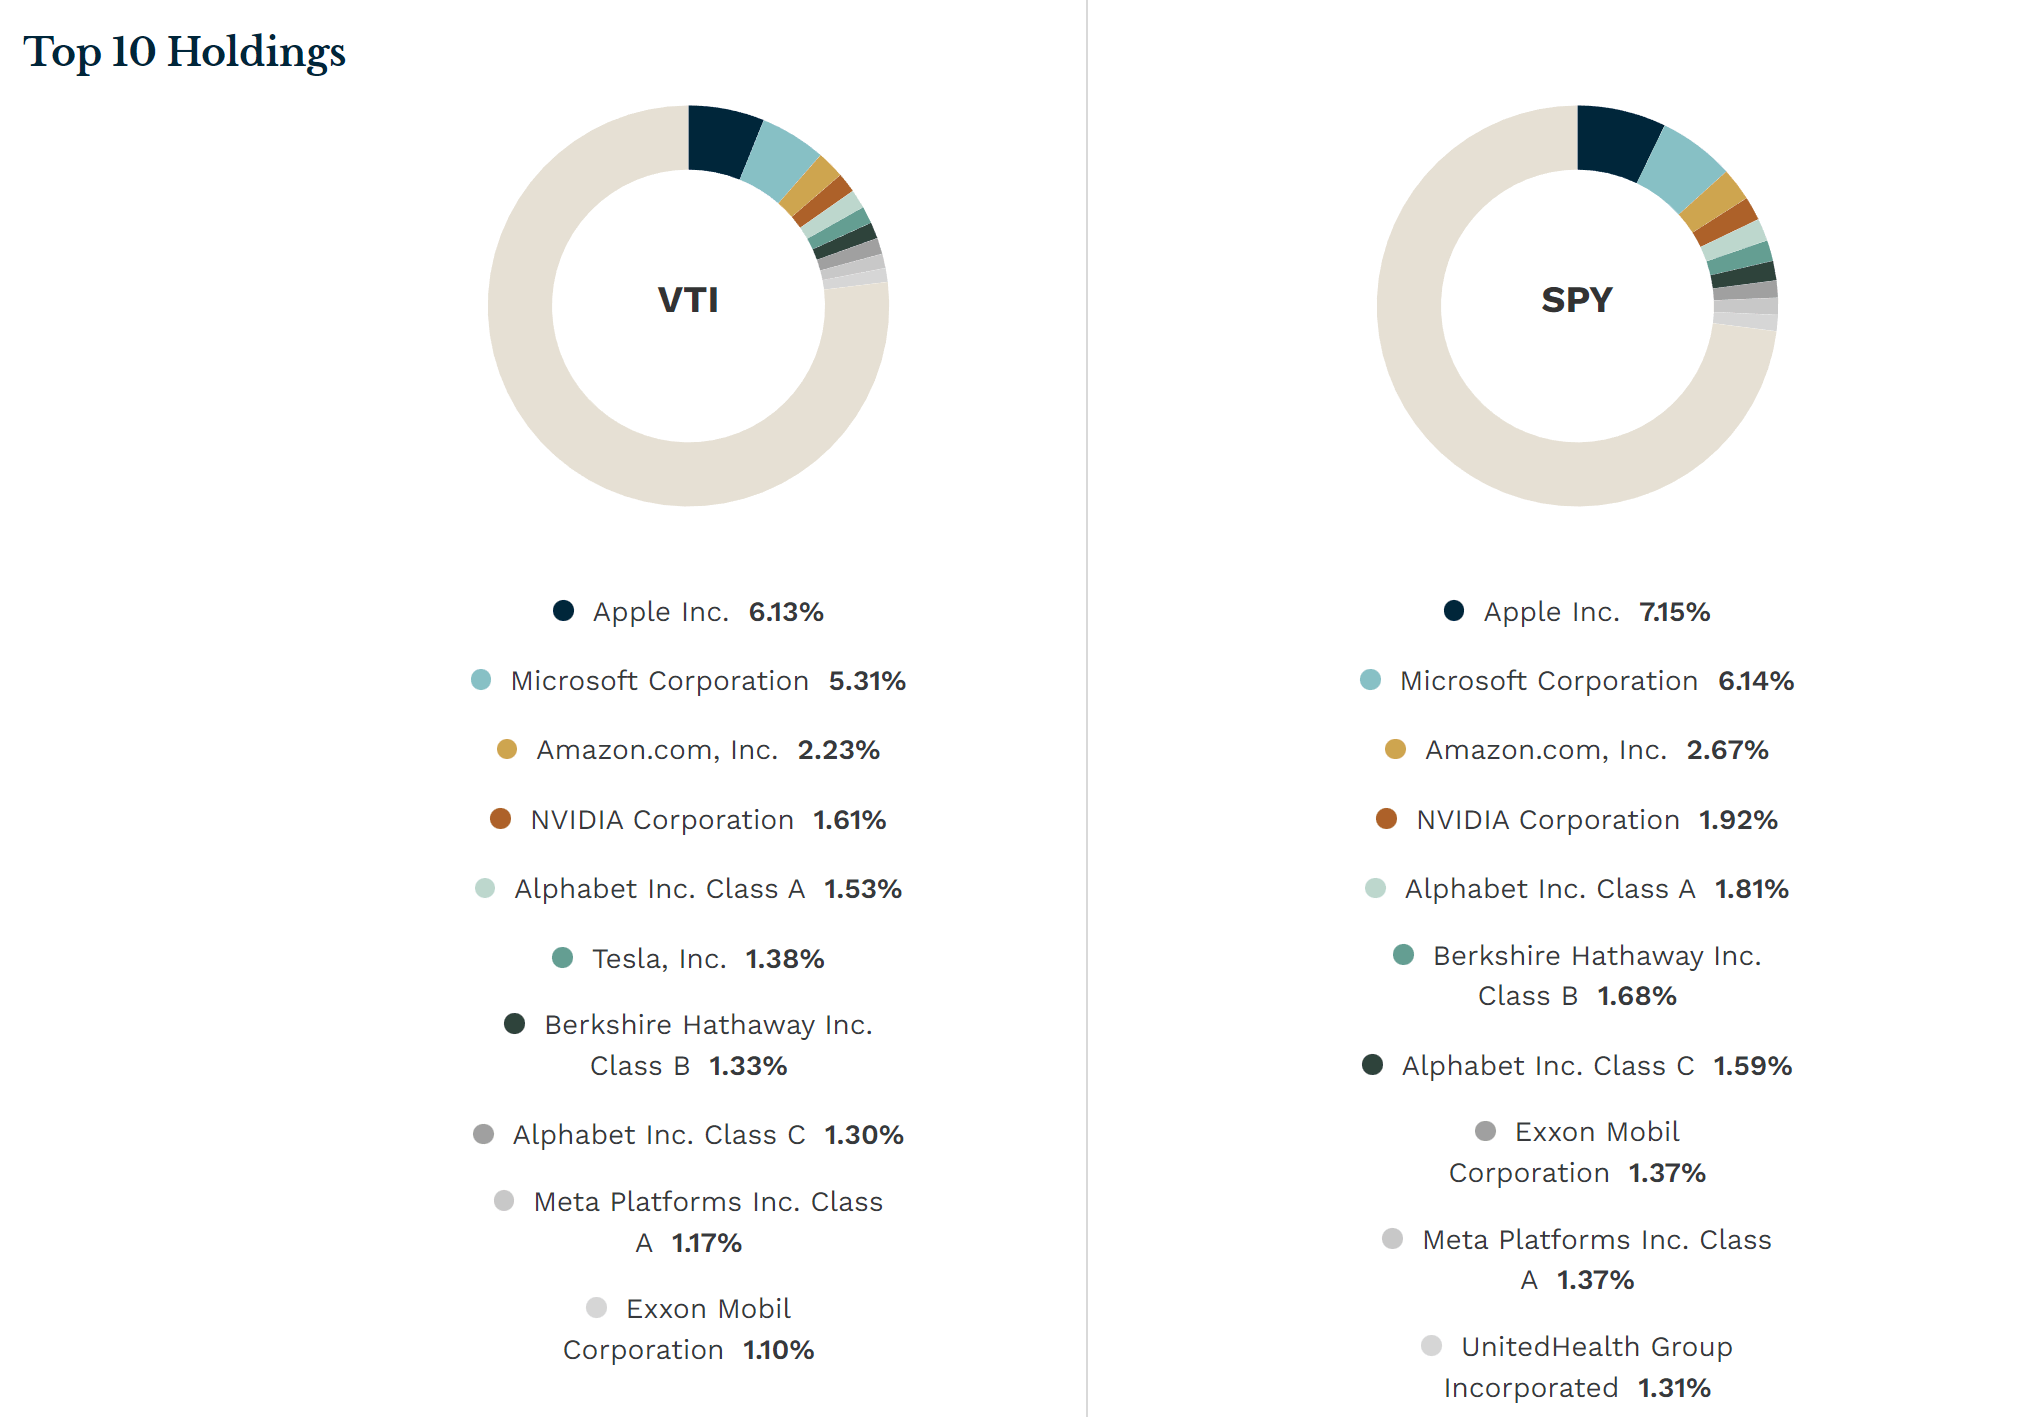
These funds are similar enough that they can be used interchangeably most of the time (for example, see their top 10 holdings in the first chart below). The operative word here is “most of the time”. But not all the time. And the thesis is to argue why now is a time when their differences matter. In the rest of this article, we will elaborate on our argument from the following aspects:
- What are the differences between VTI and SPY?
- Why do these differences lead us to believe VTI has a better return profile than SPY going forward?
- And finally, how do we exactly use and adjust VTI in our actual portfolio?
The difference and why it matters
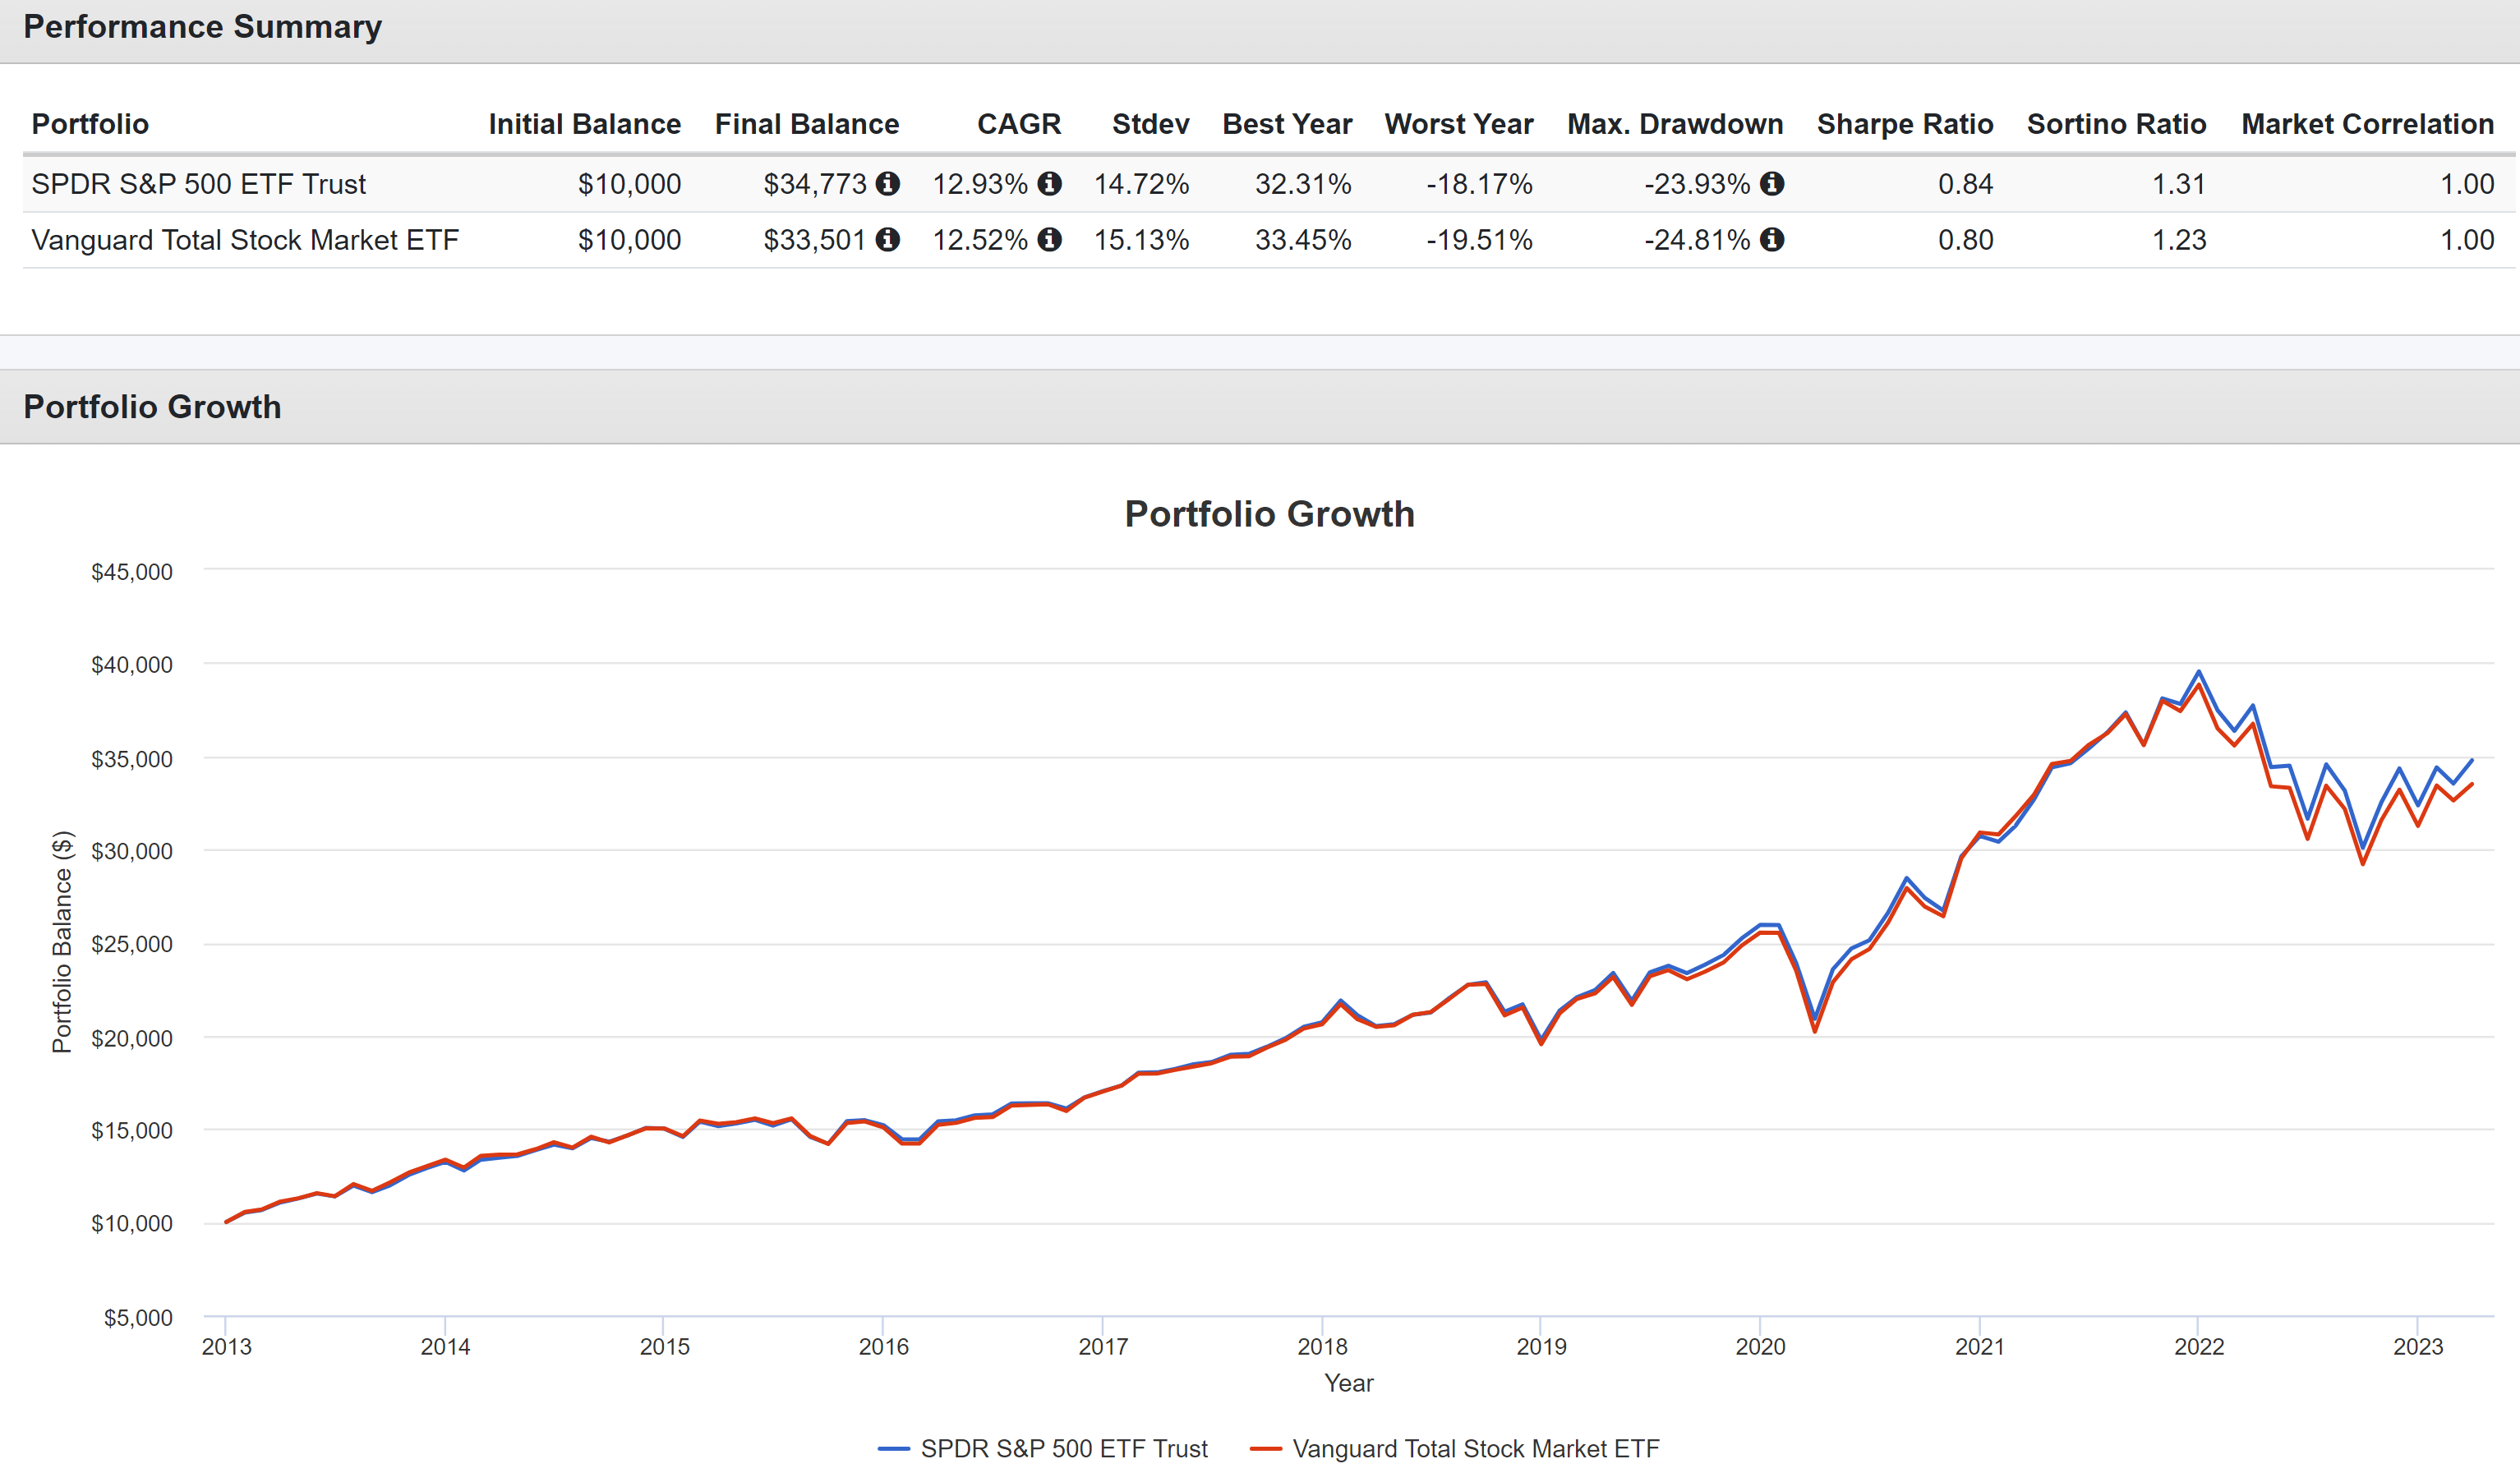
Due to their similar (but not identical) broad market representation, these funds have shared remarkably similar past performance and risk profiles as seen in the chart below. Their price actions have closely tracked each other, almost overlapping entirely (at least till 2021). In the past decade, the annual return difference between the two funds was only ~0.4% (12.93% from SPY vs. 12.52% from VTI). And bear in mind that part of this difference is due to VTI’s lower fee of 0.03% compared to SPY’s 0.09%.
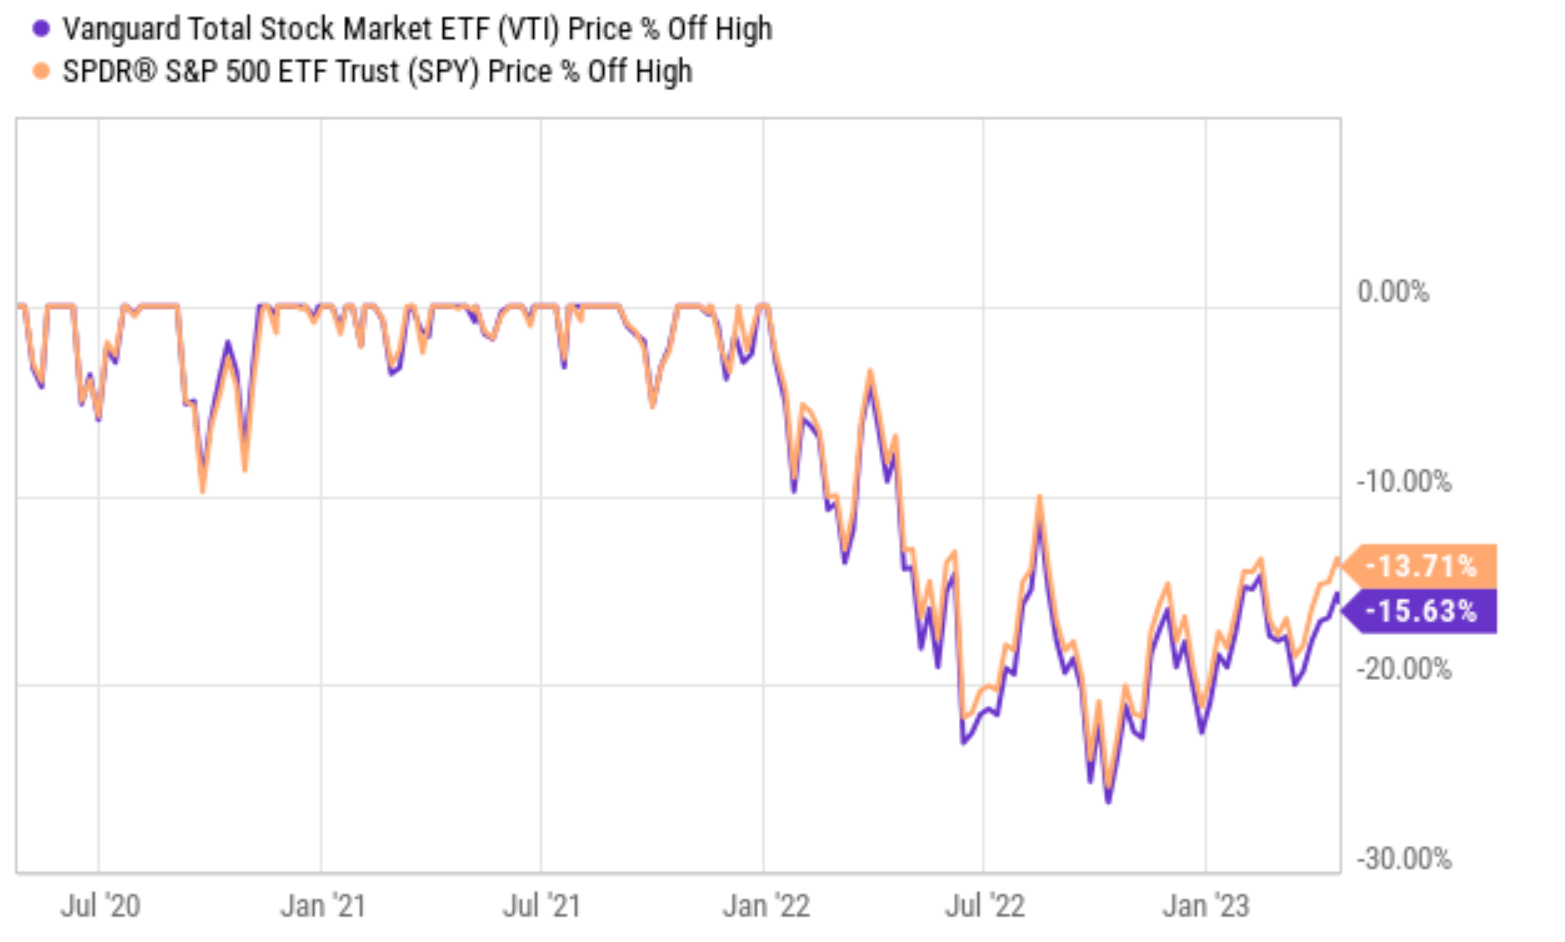
However, you can also see their performance began to take a more apparent divergence starting sometime between 2021~2022. To see the divergence more clearly, the next chart zooms on the recent three years and compares their price corrections off their peaks.
Both SPY and VTI have undergone a substantial correction since 2021, with SPY losing 13.71% of its peak price and VTI losing 15.63%. In other words, their performance has diverged by about 2% in the past 1~2 years. While a 2% divergence may not appear significant in absolute terms, it is considerable when you compare them to their historical levels as analyzed above. Again, their annual performance in the long term has been within 0.4%.
And 2% is a LOT more than 0.4%. Hope this gets your attention enough to read on. And we will next elaborate more on the investment implications of the 2% divergence.
VTI vs. SPY: valuation and return evaluations
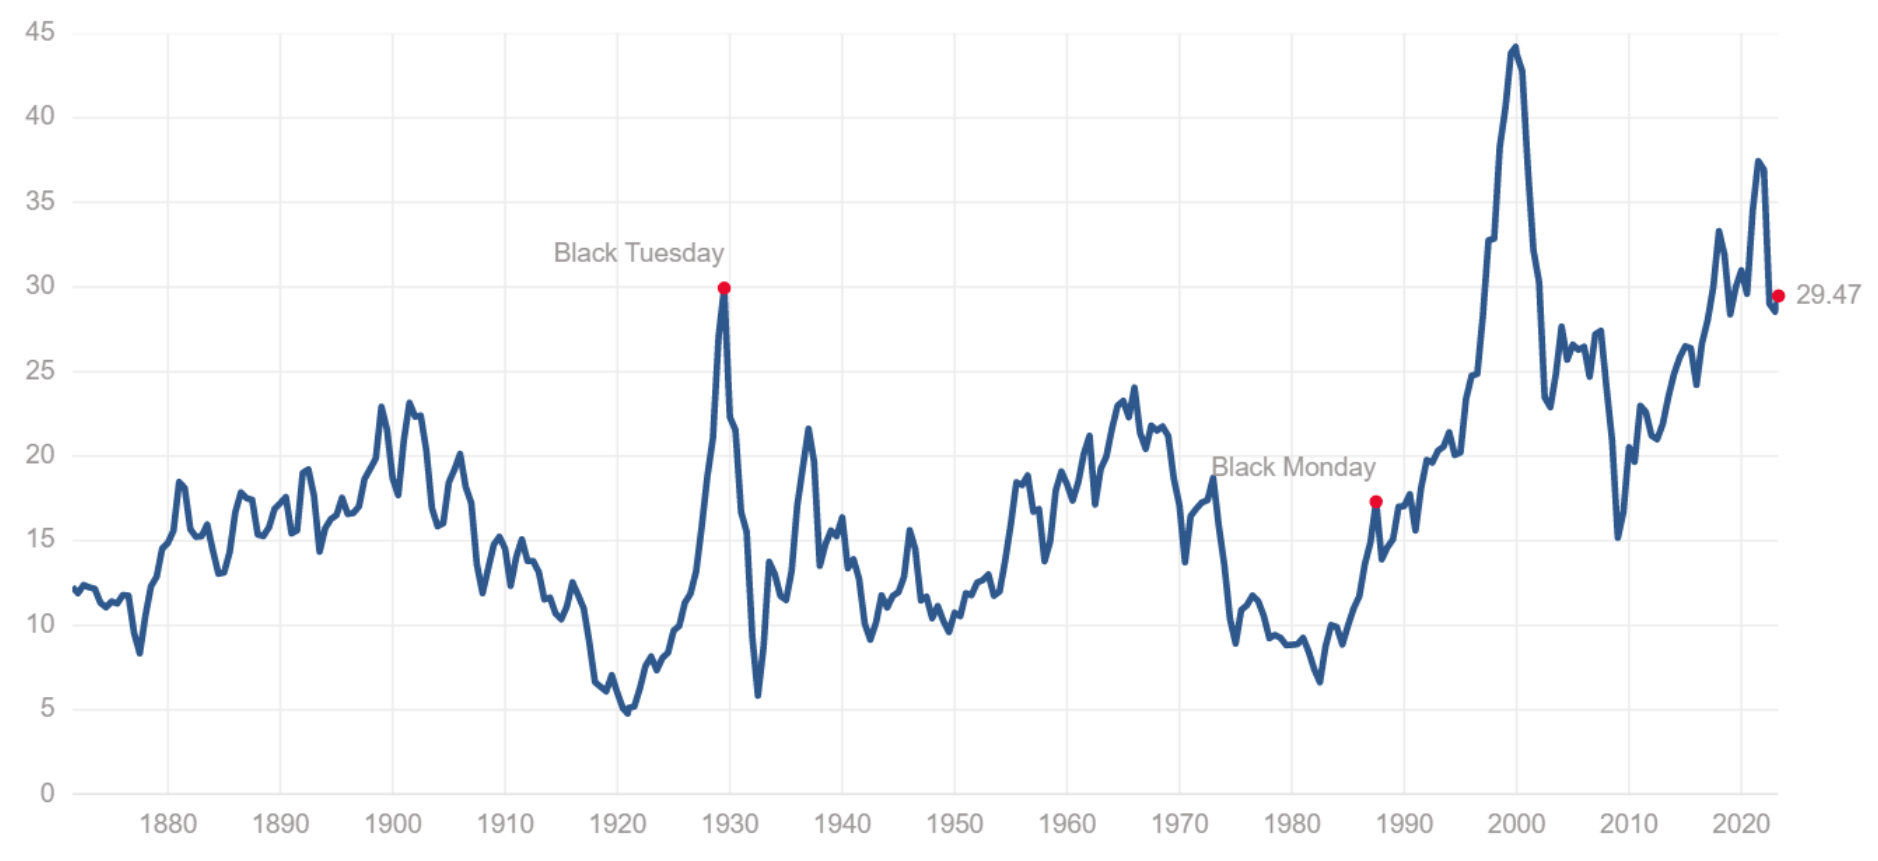
First off, we need to clarify that neither VTI nor SPY is cheap in our view. Our thesis is that VTI is comparatively cheaper (and the lower fee helps too) than SPY due to the larger correction shown above. I am sure you are familiar with all the metrics such as the S&P 500 P/E ratio and the Shiller CAPE ratio (which hovers close to 30x as shown below). The valuation multiple for VTI is very close due to the similarity in their indexing methods. And these valuation multiples are by no means cheap.
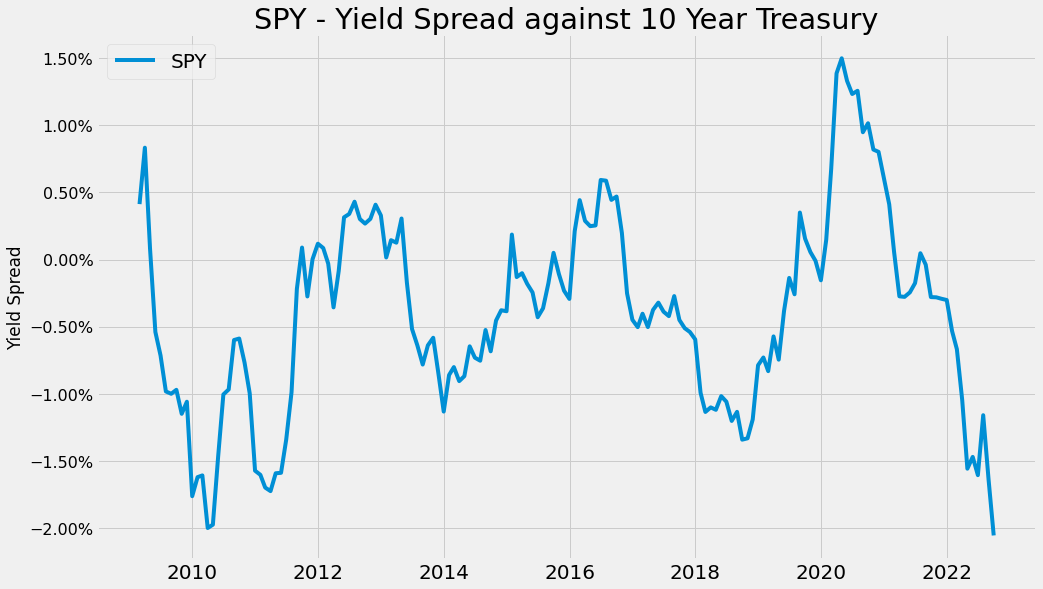
Another way, and a far better way in my mind, to contextualize their valuation is via their yield spread against risk-free interest rates. As detailed in our earlier article , the yield spread relative to risk-free interest rates provides insight into the risk premium, market sentiment, and relative value of different assets to help investors make informed investment decisions. The yield spread (“YS”) is a timeless concept the way I see it. No matter how times change, the YS spread ALWAYS provides a good measure of the risk premium. And unfortunately, the YS picture for SPY (shown below) suggests a record risk premium.
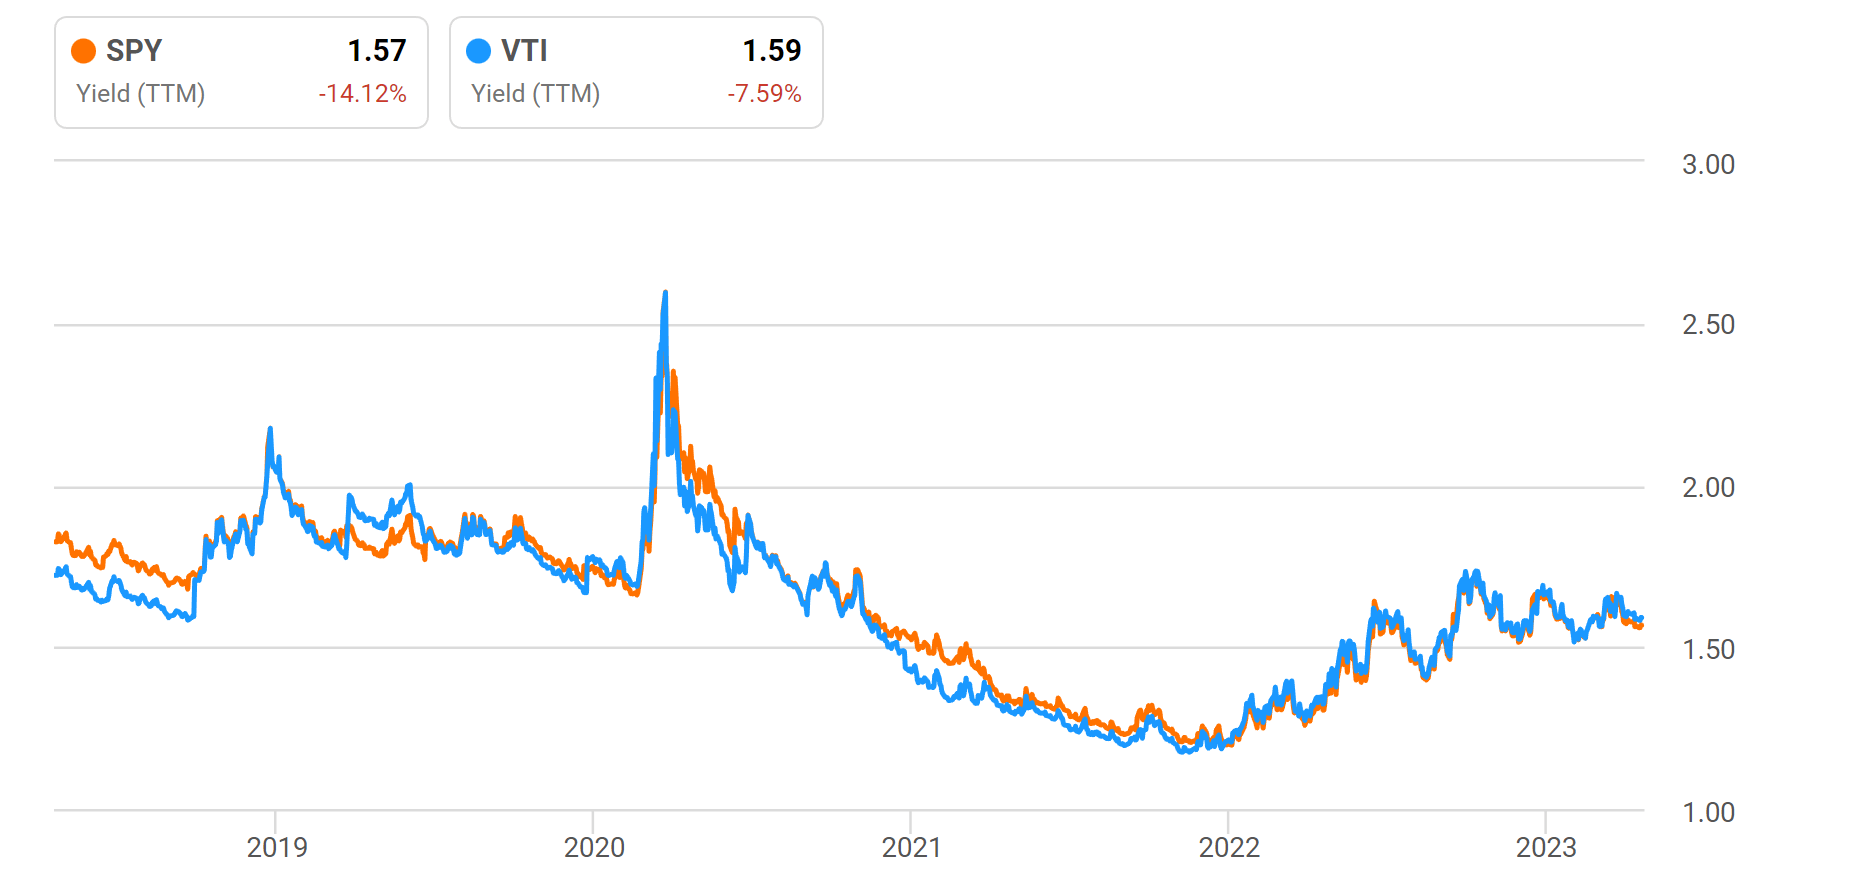
The YS has oscillated between about +0.75% and -2% in the long term with an average of about -0.65%. Currently, the YS between SPY and 10-year treasury rates is near the -2% level (1.57% dividend yield from SPY minus 3.57% 10-year treasury rates). The picture for VTI’s YS is very similar because VTI and SPY’s dividend yields are very similar (see the second chart below).
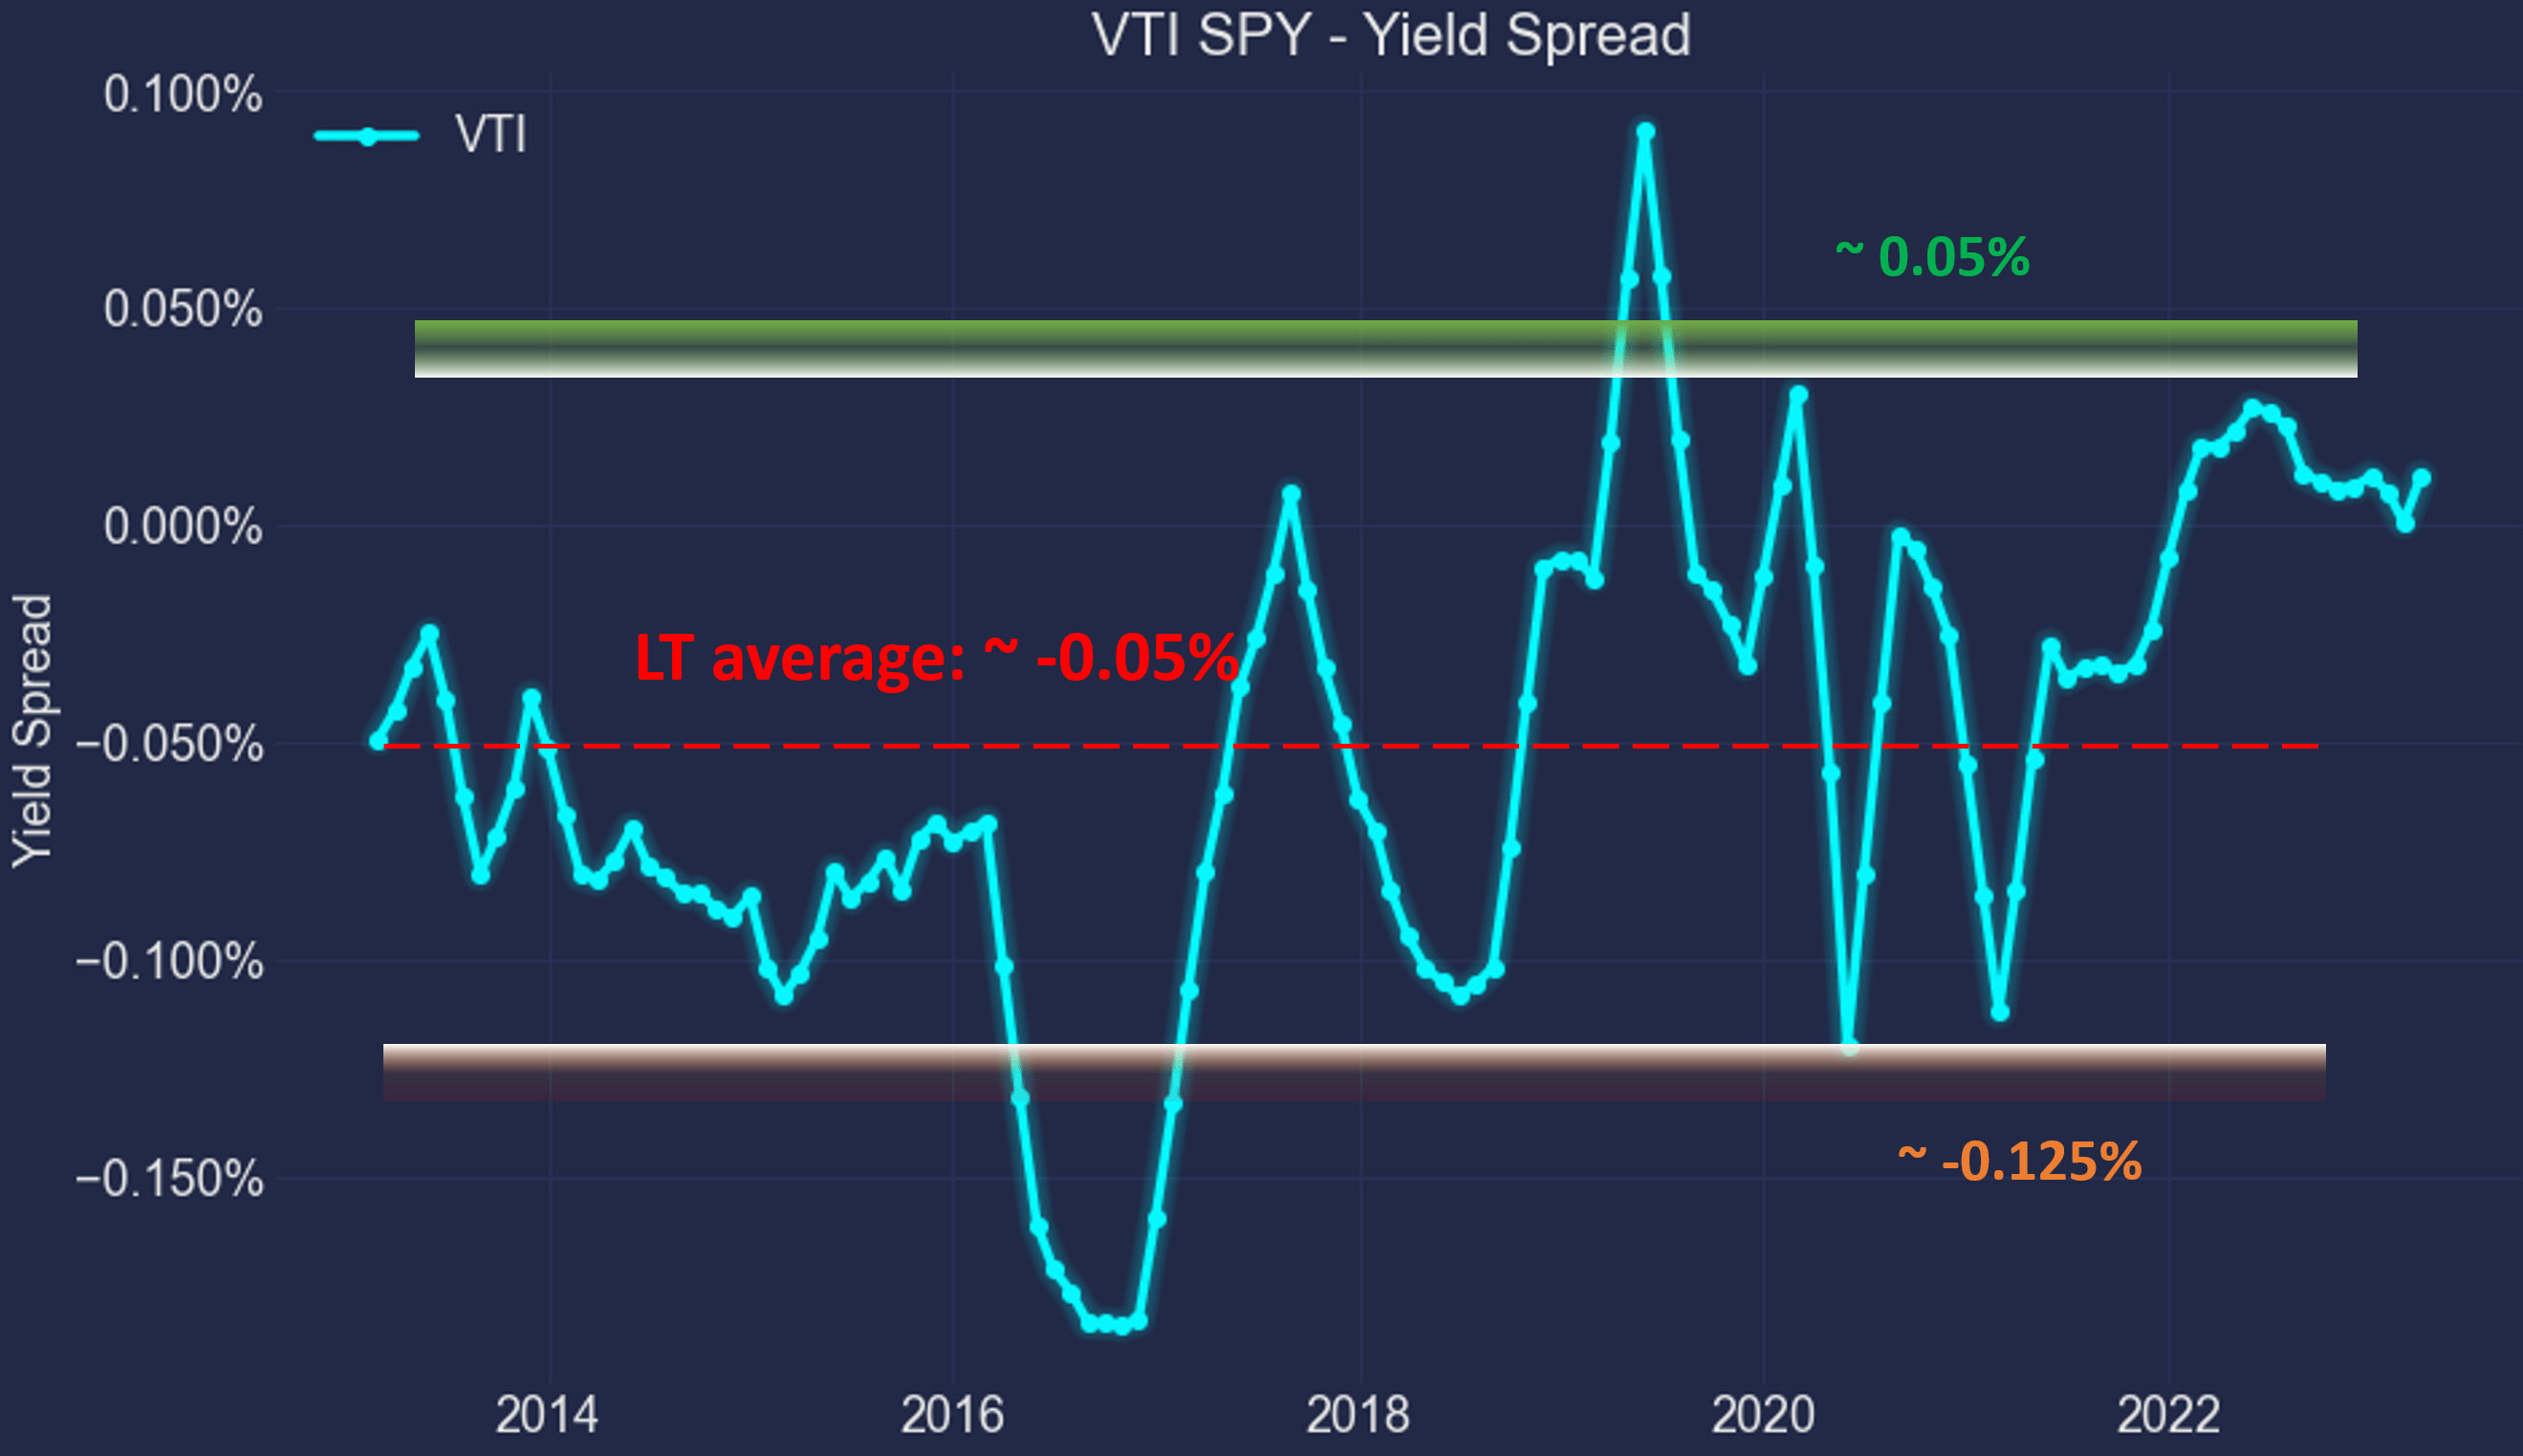
However, the key word here is again “very similar”, but not identical. To better see the difference, the following chart displays the YS between VTI and SPY. While the YS against 10-year treasury bonds highlights their similarities. But their differences were largely buried by the wider fluctuations in the treasury rates. Once you remove the treasury rates from the equation and directly take the difference between these two funds, their differences become much clearer.
As seen, the spread has a defined range as it should (after, both funds represent the same broad equity market). Their YS has been predominantly bounded between approximately 0.05% and -0.125% in the past decade, with an average of about -0.05%. Do not be misled by the absolute magnitude of these numbers. The relation position of the YS is what matters.
To wit, as of now, the yield spread is slightly below 0%, with VTI and SPY both yielding about 1.6%. And as seen, this YS is close to the upper end of the historical range (close to the 75th percentile of the historical range), suggesting that VTI valuation is substantially discounted relative to SPY.
Risks and actionable ideas
Discussing the fundamental risks associated with VTI and SPY is essentially discussing our macroeconomic risks. And such discussions occupy the headlines at both Seeking Alpha and other places daily (and we’ve contributed our fair portion). So, we won’t further add on this front here anymore. Instead, we want to point out two risks associated specific to the methods used in this analysis:
- It's important to point out that there are limitations in the use of YS as a valuation metric. As we explained in an earlier article , dividend yields don't always reflect business fundamentals. A multitude of extrinsic factors such as tax laws and political climate could impact dividend policies. We don't rely solely on YS. We adjust for the extrinsic factors and then use the adjusted YS. Nonetheless, the YS is always an excellent starting point.
- Again, we are not trying to argue that VTI is cheap. Our thesis is that VTI is comparatively cheaper than SPY under current conditions. And there are risks inherent to any comparative analysis. Such analysis is oriented toward relative performance and not absolute performance.
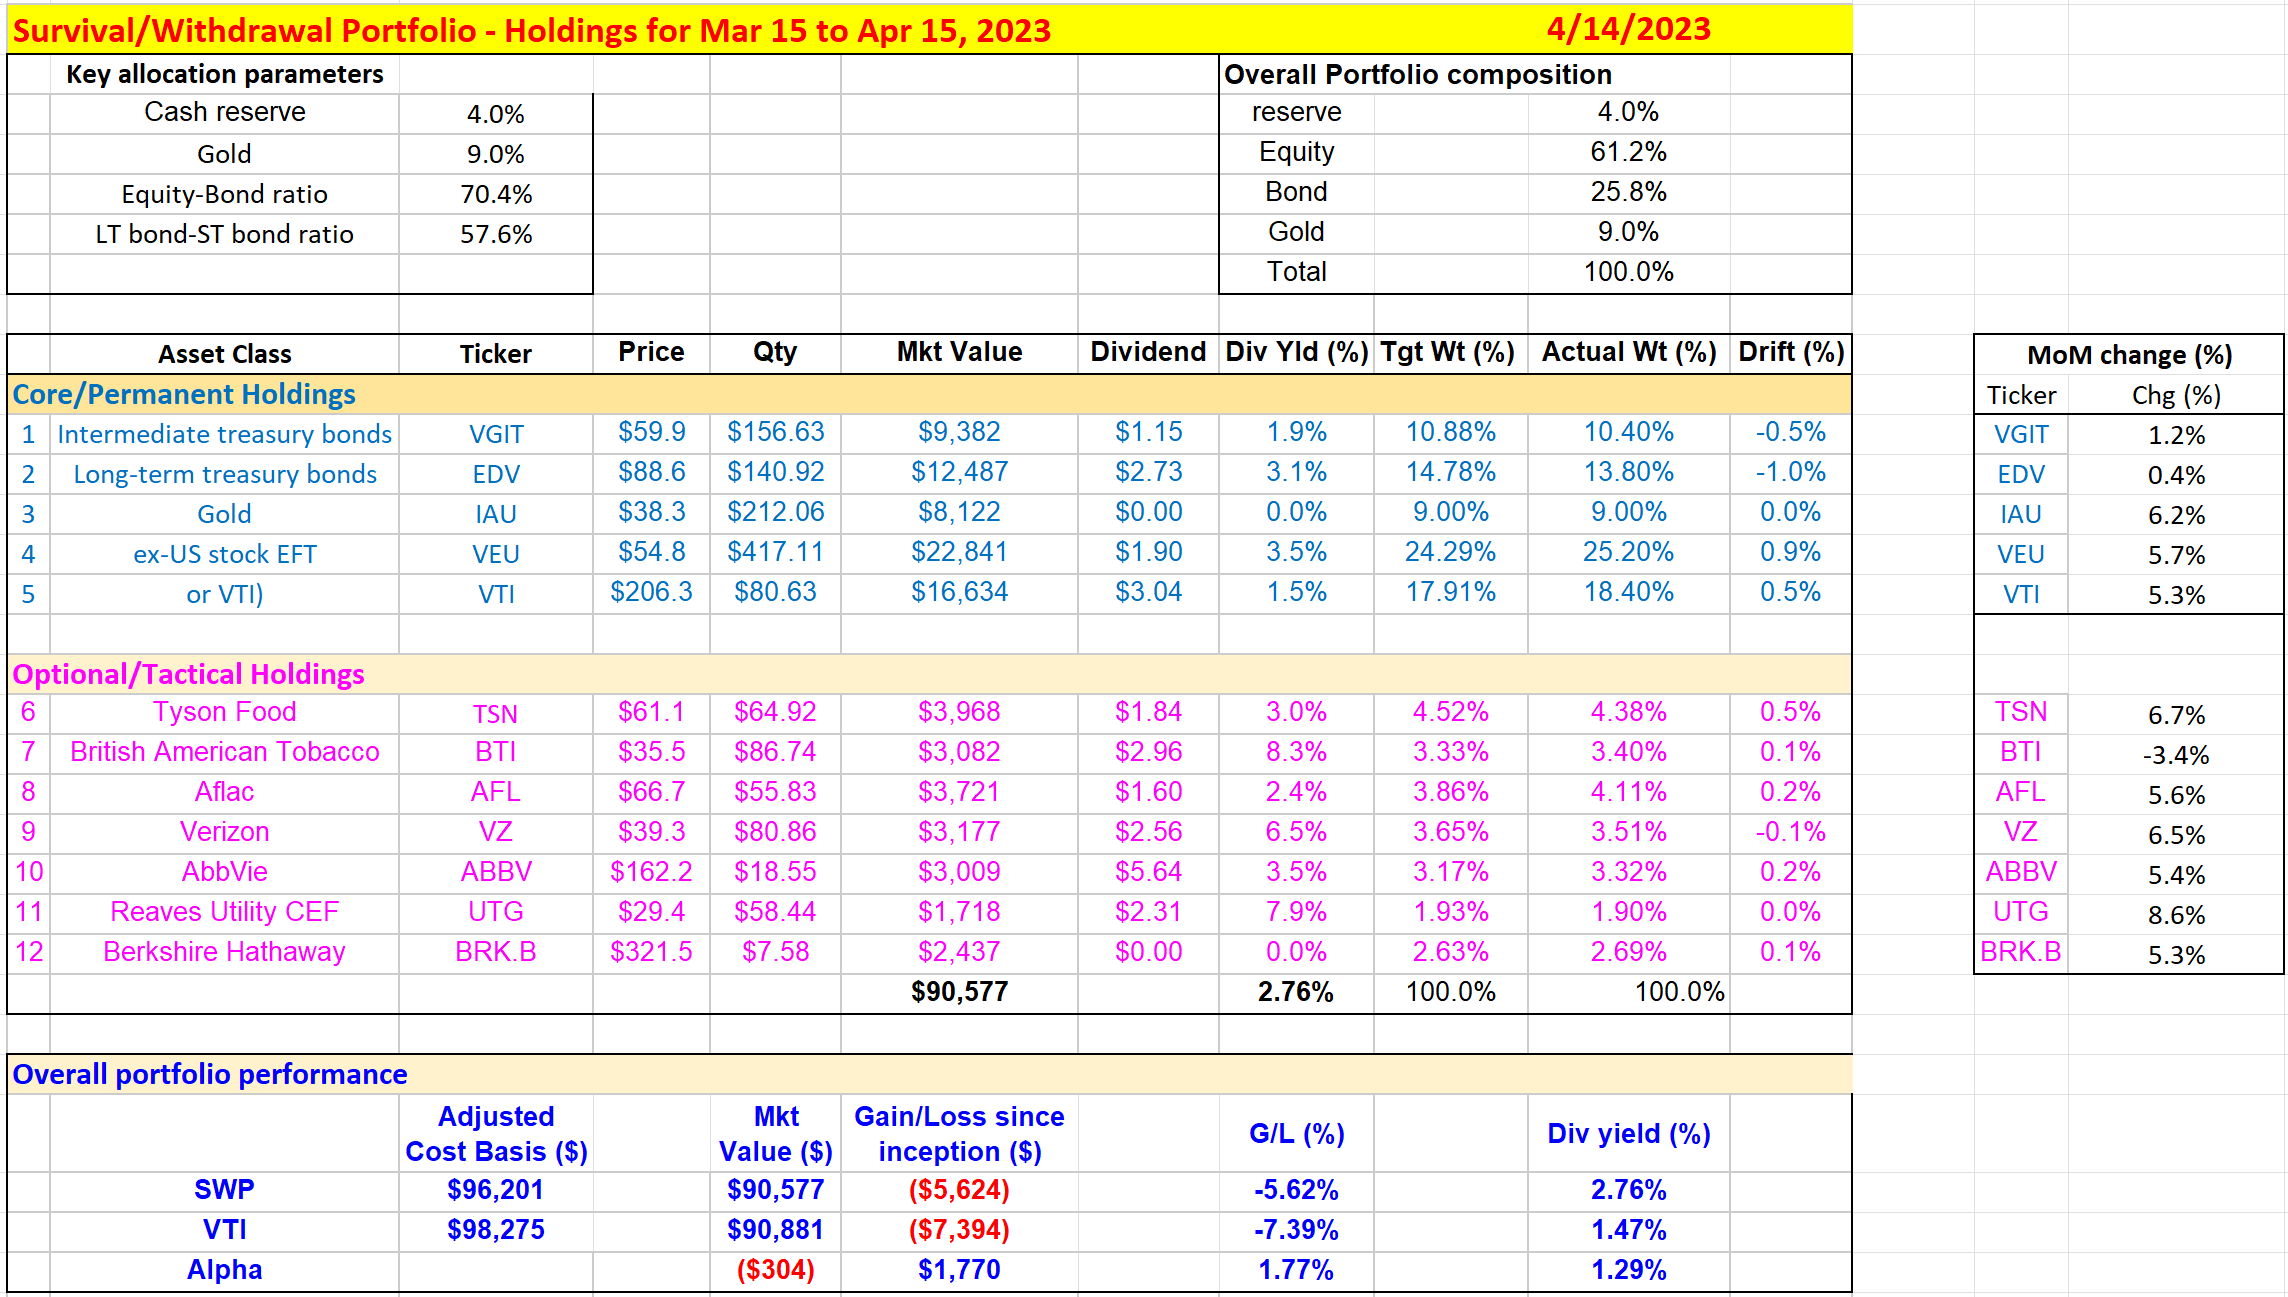
Finally, let’s conclude with a few actionable investment ideas. As aforementioned, we prefer and actually hold VTI in our portfolios. To offset the high risk premium indicated by the narrow YS, we use a barbell strategy that involves setting aside cash and allocating a good portion of our assets to bonds. And the allocation is precisely based on the YS between equity and bonds analyzed above.
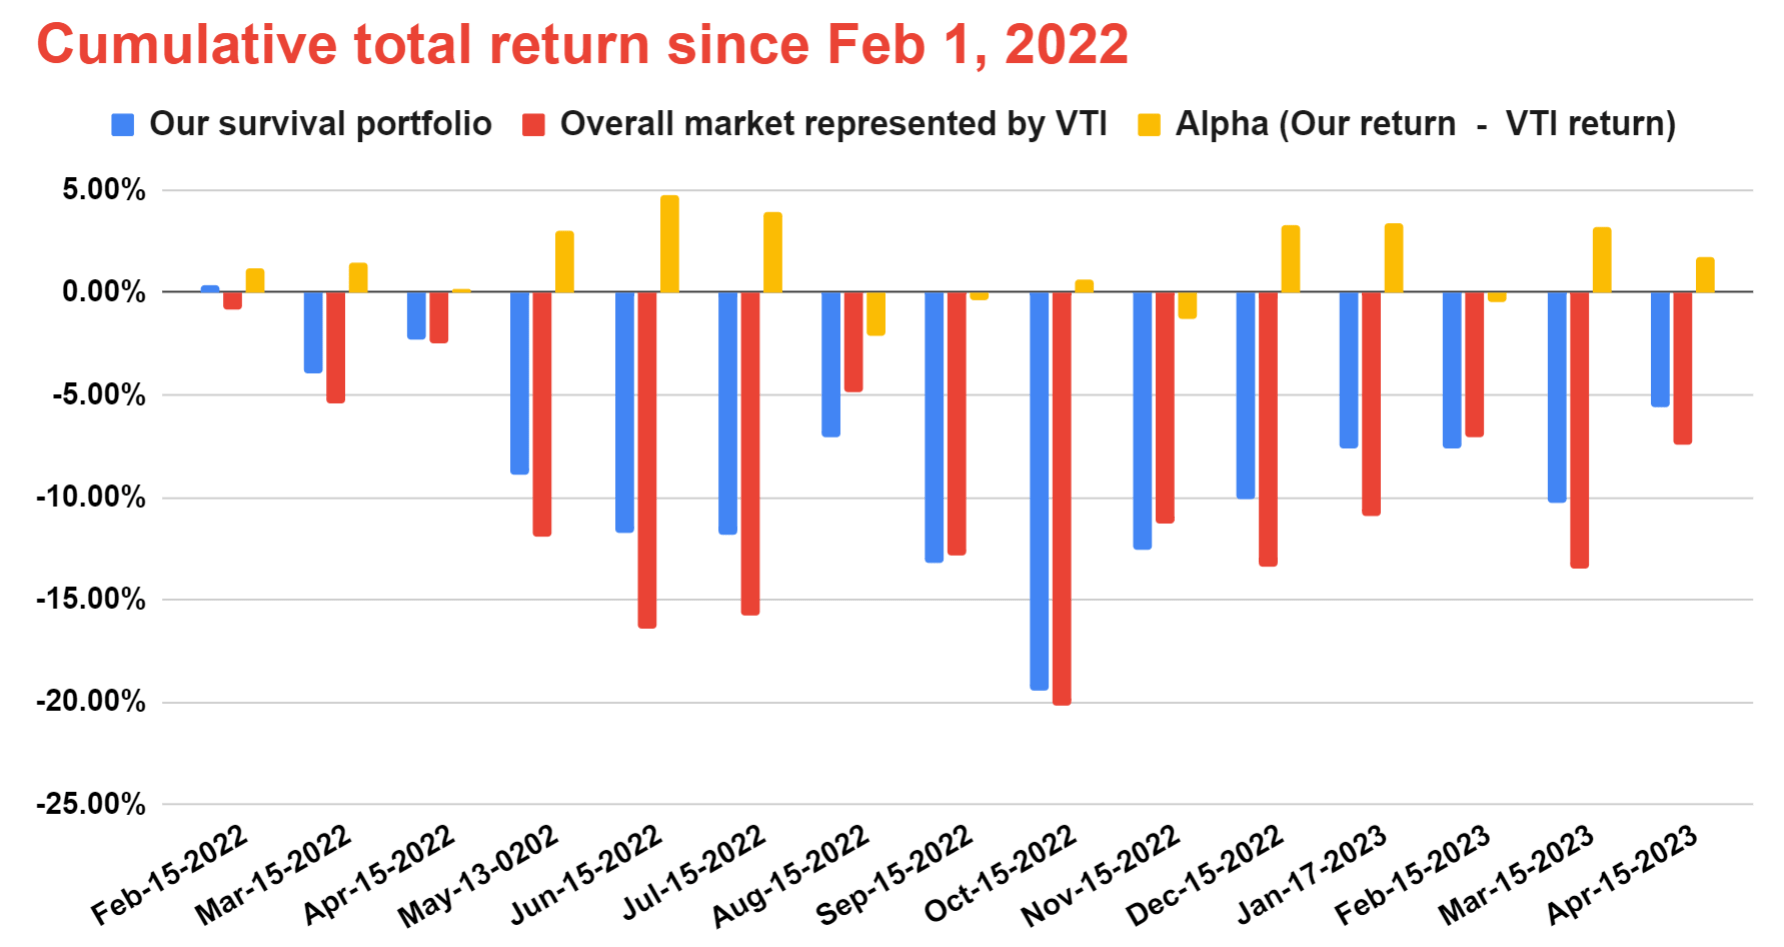
Our actual holdings and their performance since Feb 1, 2022 (when we started publishing the portfolio to our investment group) are shown in the next two charts. We provide an update of our holdings monthly in the middle of each month. As seen, VTI is our core holding for U.S. exposure. With a simple portfolio (no more than a dozen tickers in total), our portfolio has been outperforming the broader market and suffering lower volatility at the same time.
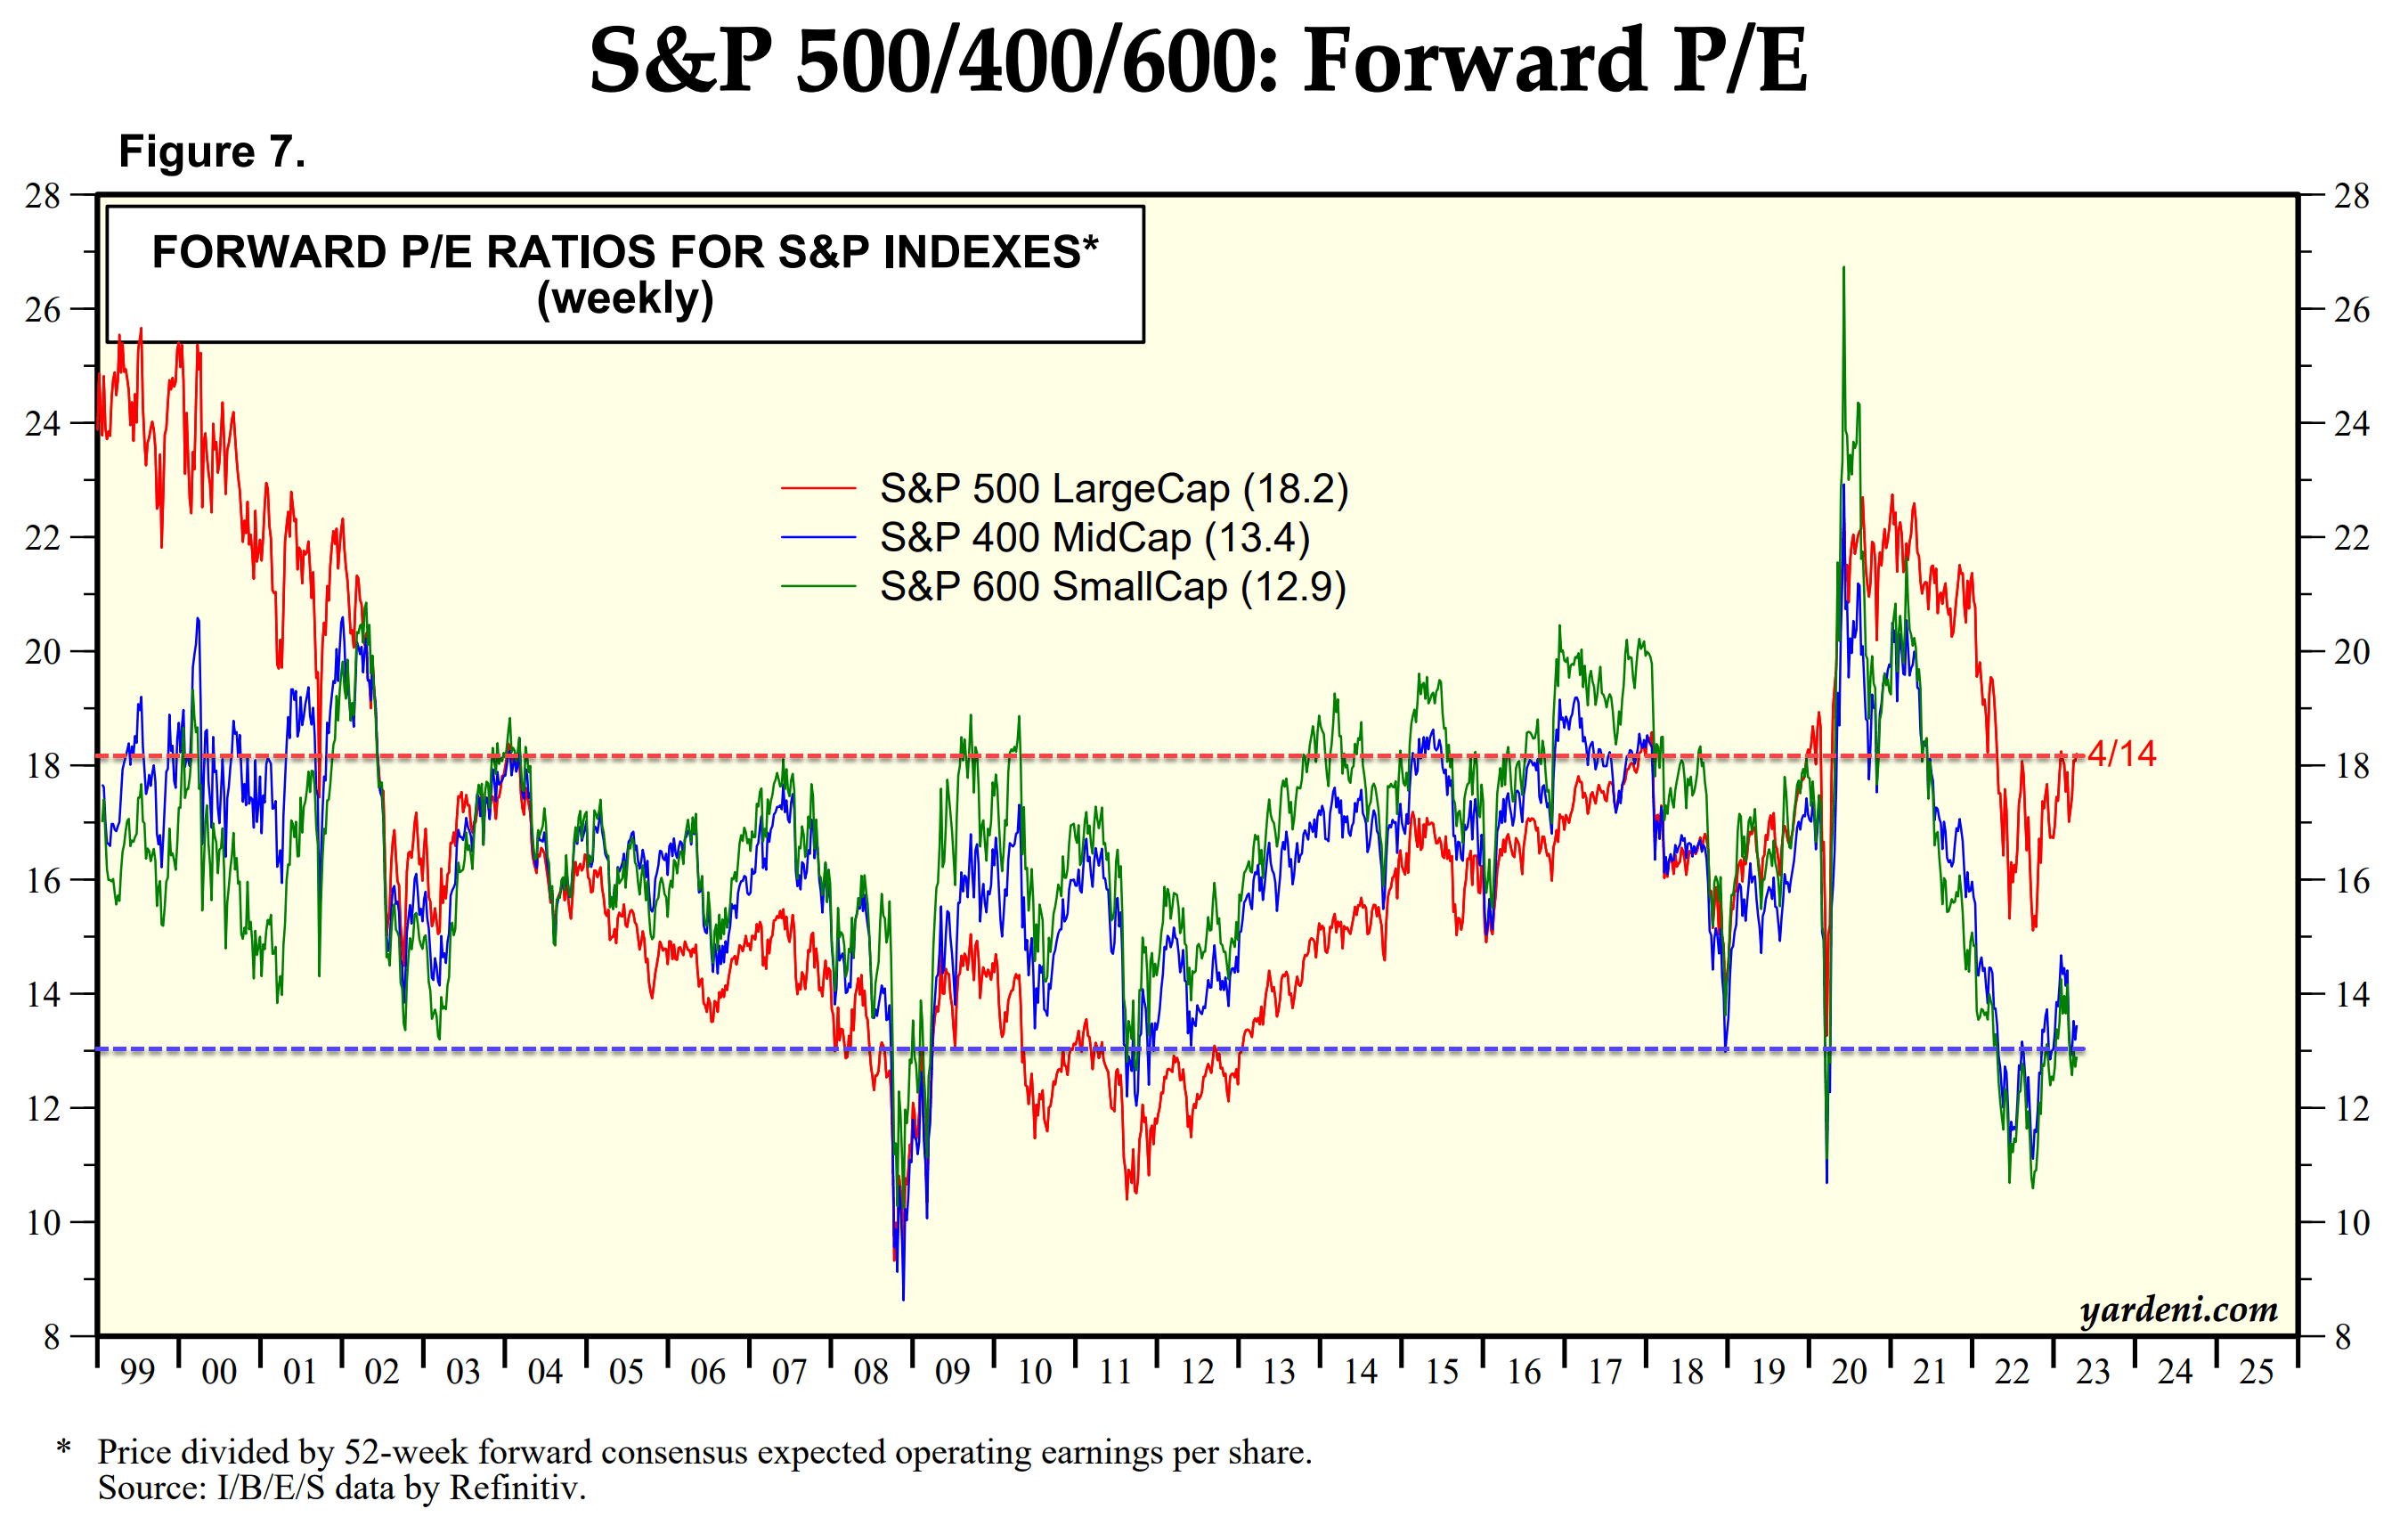
Investors with a higher risk appetite might consider investing in mid-caps and small-caps. VTI's exposure to these sectors is the primary reason for the valuation discount compared to SPY in our view. As such, if you can tolerate the risks, now is a good time for a more concentrated bet on mid- and small-caps. As shown in the chart below, mid-caps are currently valued at 13.4x FWD P/E, which is 26% discounted compared to large-caps (i.e., SPY). Small-caps are even more cheaply valued, with 12.9x FWD P/E. Additionally, their P/E multiples are among the lowest valuation multiples since 1999 as seen. Valuations close to their current levels only occurred about 3 times since then: the COVID-19 crash, the 2008 crisis, and its 2011 aftermath.
For further details see:
VTI Or SPY? Why We Choose VTI