WDC - Western Digital: Continuing To Underperform Seagate
Summary
- Seagate has outperformed Western Digital in the all-important Data Center HDD segment.
- As Seagate began lowering HDD prices, its data shipments have increased and exceeded those of Western Digital.
- Both companies have reported lackluster CYQ4 earnings, which are attributed to macro factors influencing data center capex and a drop in demand for consumer electronics products.
- Seagate’s next-generation HDD will go into production at least a full year ahead of Western Digital.
More than 90% of exabytes in cloud data centers are stored on HDDs, and the remaining 10% are stored on SSDs.
Western Digital ( WDC ) reported in its FQ2 2023 a Non-GAAP EPS of -$0.42 that missed by $0.29. Its FQ2 GAAP operating loss was $321 million and Non-GAAP operating loss was $119 million. In addition to the weak second-quarter, WDC said it expects third quarter revenue to be between $2.6B and $2.8B.
It expects to lose between $1.70 and $1.40 per share during the period, excluding one-time items, including underutilization charges in flash and HDD (hard disk drive) totaling $250M.
WDC also reported revenue of $3.11 billion, down -35.6% YoY. Analysts had been expecting $3.12 billion in revenue and an adjusted loss of 32 cents per share.
Comparison With Seagate
Exabytes of Data
WDC reported that sequentially total HDD exabyte shipments decreased 35% and average price per hard drive decreased 21% to $99. Nearline bit shipments were 61 exabytes, down sequentially, driven by inventory digestion. Client represented 35% of total revenue at $1.1 billion, down 11% sequentially.
In contrast, in its earnings call a week earlier, Seagate CFO Gianluca Romano noted in the company’s FQ2 earnings call :
“Shipment into mass capacity markets totaled 97 exabytes, down 7% quarter-over-quarter. Of this total, roughly 82% were derived from nearline products, shifting to cloud and enterprise OEM customers. Nearline shipments of 80 exabytes were down 6% sequentially and roughly 30% of our recent high.
Total hard disk drive shipments were 113 exabytes in the December quarter, down 5% quarter-over-quarter, with HDD revenue declining 6% sequentially to $1.7 billion.”
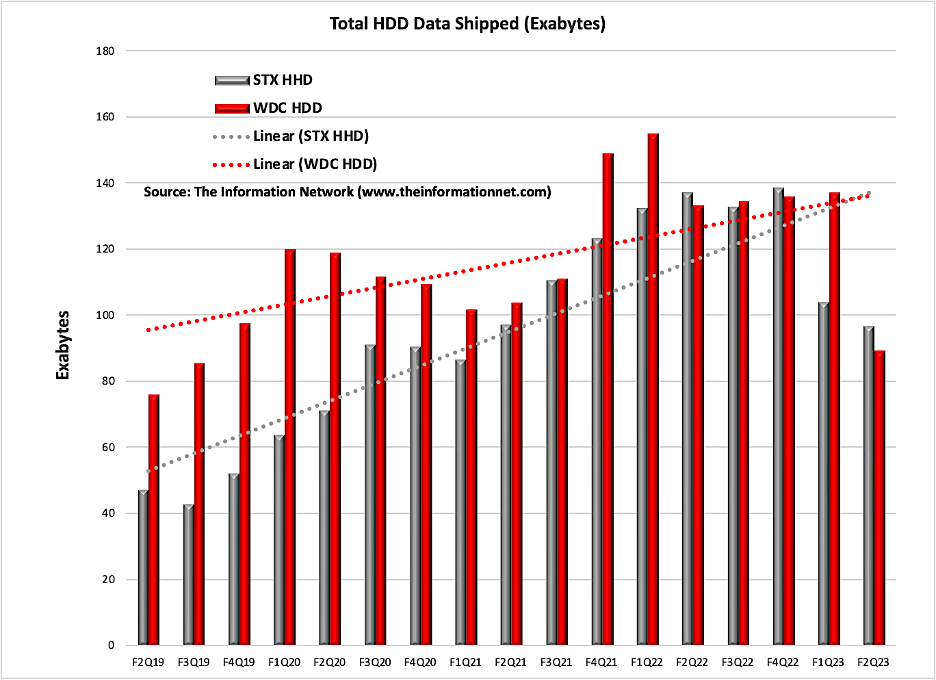
Chart 1 illustrates total exabyte data shipped for both companies between F2Q19 and F2Q23. WDC outperformed Seagate ( STX ) until F2Q22, and the trendlines show cross at F2Q23 illustrating exabyte data has equalized.
The Information Network
Chart 1
Graphically, I compare data for the two companies in Chart 2, which shows two important metrics:
• The top two lines compare nearline Data Center HDDs shipments for Seagate (gray line) and Western Digital (red line) between F2Q19 and F2Q23. For Seagate it shows a significant drop in F1Q23 of 28.5% in nearline followed by a F2Q23 drop of 6.3%. It compares to a F1Q23 increase of 0.9% for WDC followed by a F2Q23 decrease of 45.5%. Trendlines (dotted lines) for both are positive but growth is stronger over this period for Seagate.
• The bottom two lines compare “other” primarily legacy, HDDs for Seagate (yellow line) and WDC (blue line). For STX, the trendline (yellow dotted line) is positive, versus negative for WDC. It is this sector that is most vulnerable to competition from SSDs (solid state devices made from NAND chips).
The Information Network
Chart 2
Mass capacity storage involves well-established use cases — such as hyperscale data centers and public clouds as well as emerging use cases.
Legacy markets are those that STX continues to sell to but does not plan to invest insignificantly. Examples include Consumer Storage for backups for PCs and gaming, and Client Storage for PCs, DVRs, and premise monitoring equipment.
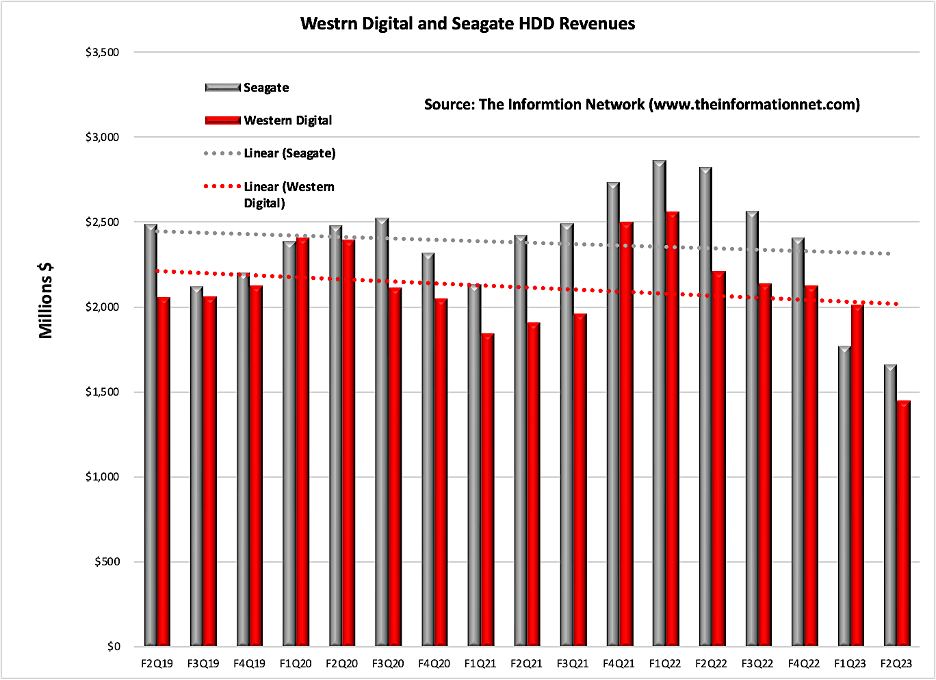
Revenue
WDC’s HDD revenue was $1.5 billion, down 28% sequentially and 34% year-over-year.
total revenue for the quarter was $3.1 billion, down 17% sequentially and 36% year-over-year, as shown in Chart 3. Cloud represented 39% of revenue at $1.2 billion, down 33% sequentially and 36% year-over-year.
Seagate’s HDD revenue declined 6% sequentially to $1.7 billion.
The trendlines in Chart 3 are parallel with Seagate revenues greater than those of Western Digital. These trendlines are different from those in Chart 1 above, that shows Seagate’s stronger growth in HDD exabyte output vs. WDC.
The Information Network
Chart 3
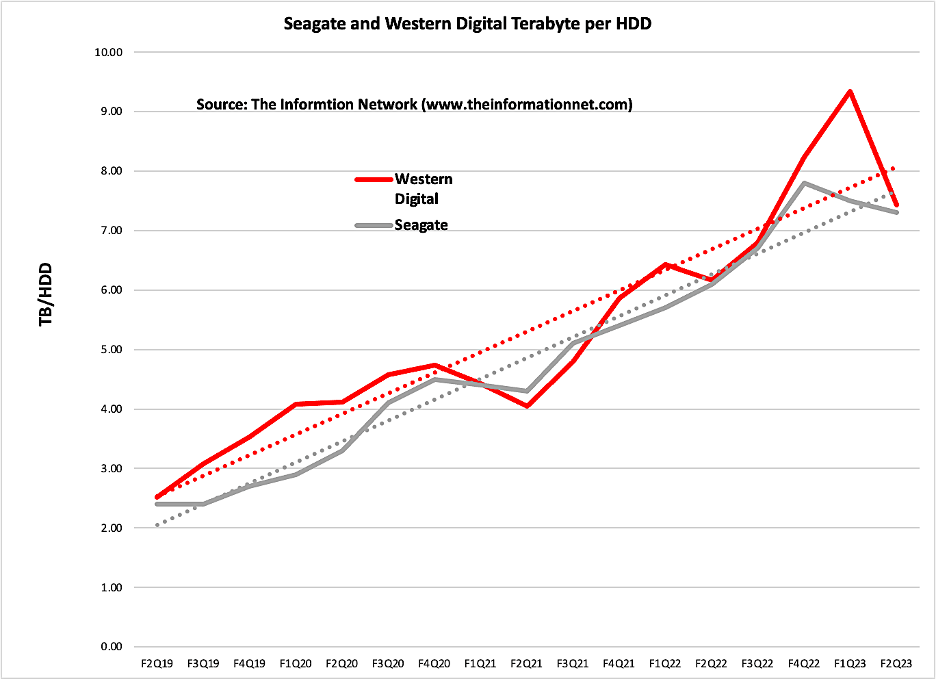
Terabyte per HDD
To reconcile the different trend lines in Chart 1 versus Chart 3, in Chart 4 I show the capacity of each drive from both companies. It shows comparable capacity per drive with slightly higher capacity for WDC compared to STX. Importantly, the trendlines show that this relationship has been constant over the period of F2Q19 and F2Q2.
The Information Network
Chart 4
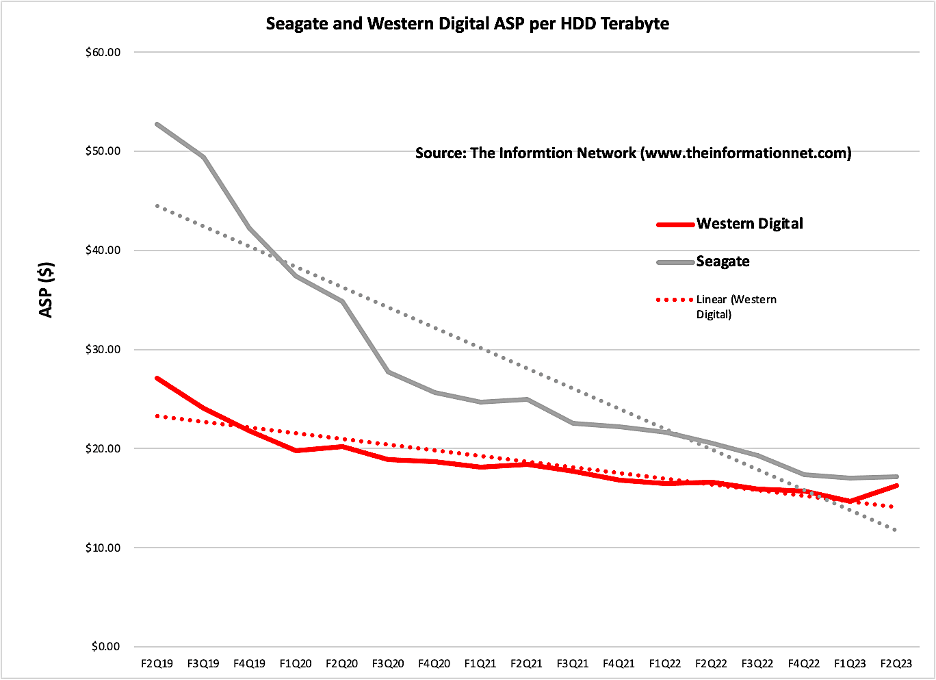
ASP (Average Selling Price) per Terabyte
To reconcile the different trend lines in Chart 1 versus Chart 3, in Chart 5 I show ASPs per HDD Terabyte of data. It's clear that Seagate’s ASPs were priced higher per terabyte.
Thus, the revenues in Chart 4 are greater for STX because of higher ASPs, but the lower exabytes of data in Chart 1 is probable due to the much higher ASPs of STX, as much as 2.5X greater than WDC in F2Q19 that dropped to ASPs on par in F2Q23.
In other words, Western Digital more exabytes of data early in the timeframe of this analysis because of Seagate’s high prices. When Seagate reduced prices, shipments increased.
The Information Network
Chart 5
Investor Takeaway
WDC’s share price has underperformed main competitor STX in the past four-year period, as shown in Chart 6, which is the same timeframe as the above charts.
The share percentage change of STX is up 76% while WDC is down just 19%. The largest separation in share price peaked in 2022.
YCharts
Chart 6
Chart 7 shows share price for the two companies, for the four-year period along with the 10-year Treasury Rate. We can see the inverse correlation between the 10-year treasury and share price.
YCharts
Chart 7
I have written exclusively about this relationship in Seeking Alpha articles. The 10-year Treasury started increasing at the beginning of 2022 in correlation with a drop in share price of nearly all technology stocks. Share prices have risen recently as the 10-year treasury rate decreased.
According to an article in Nasdaq.com:
"The most crucial factor driving tech stocks in 2022 has been the 10-year Treasury yield. This is the yield investors earn for buying 10-year notes issued by the U.S. Treasury. It's the rate of annual return investors can expect when buying a risk-free bond from the U.S. government. And it's widely considered the U.S. economy's "risk-free rate."
Chart 8 shows Seeking Alpha Quant Ratings for the two companies are different, but both have a Quant Rating of Hold as show in Chart 7, of which I concur.
Chart 8
Seagate has outperformed Western Digital in the nearline HDD subsegment until the recent two quarters. WDC will announce its F2Q23 on January 31, 2023, which will tell us whether the underperformance with STX continues.
As the HDD industry moves to advanced technology, Seagate's HAMR appears to be ahead of Western Digital's MAMR advanced HDD.
Indeed, STX in its earnings call reported that its 30-plus terabyte family of drives based on HAMR technology is expected to begin customer shipments of these products in the June quarter.
For further details see:
Western Digital: Continuing To Underperform Seagate