SPY - What A S&P 500 Portfolio Could Be Worth In 2023
Summary
- 9 factors considered in forecasting the S&P 500 closing price on Dec. 31, 2023.
- Apple, Microsoft, and Amazon a big factor.
- Monte Carlo model suggests a small decline.
Readers who started investing at the start of 2022 fared poorly starting with the S&P 500 ( SPY ) exchange-traded fund. How could they have known? For over a decade, the S&P 500 historically assured investors of steady positive returns. At the time of writing, S&P 500 suffered a nearly 20% decline in 2022.
Russia’s invasion of Ukraine soured investment sentiment in 2022. Though it partly contributed to global inflation, the main culprit is trillions of dollars worth of stimulus packages during the pandemic. Before that, accommodative monetary policy and near-zero interest rates fueled today’s inflationary rates.
How will 2023 fare for the investor with a $100,000 holding in only the S&P 500 index ETF? We will discuss the range of possible year-end 2023 returns toward the end of this article. I will justify the target with nine considerations.
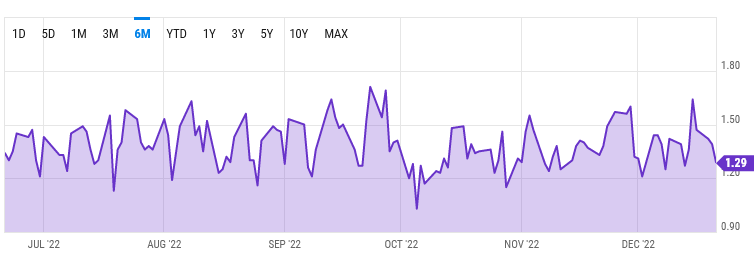
1/ Put/Call Ratio
The SPX Put/Call ratio is one short-term signal of market sentiment. In the struggle between bears and bulls, the bearish options pulled back sharply despite the S&P 500 falling from the 4,000 – 4,090 range to 3,822.
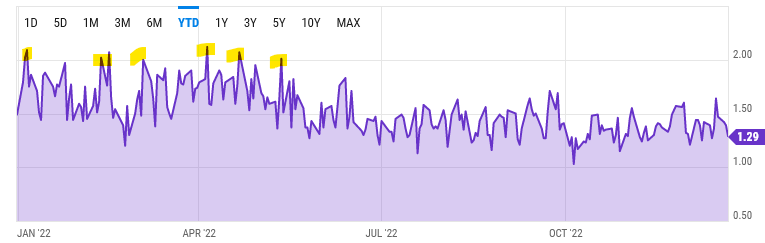
The put/call ratio will need to fall to the Oct. 2022 low of 1.03 to confirm the S&P 500’s bottom. Zooming out to early 2022, the put/call ratio topped over 2.0 times before markets headed lower.
In 2022, both put and call volumes increased. The volatility ETF ( VXX ) fell in that time. In 2023, look out for increased volatility as bulls and bears buy options to profit on wide stock price swings.
2/ Inflation
In the U.S., the Consumer Price Index rose by just 0.1% month-over-month. Inflation is up by 7.1% Y/Y. The Federal Reserve has an inflation rate target of 2%. It could take at least six months before inflation falls from 4.0% to 5.0%.
Fortunately for stock markets, The Fed raised rates by 50 bps. This is below the 75 bps hikes in every meeting before the Dec. 13-14, 2022 session. The market’s negative reaction after the rate hike suggests that stocks still must unwind the “pivot” premium. The Fed will not pause interest rate hikes until late 2023 or 2024 in my opinion. In 2024, the Central Bank is more likely to start cutting rates.
Neither the market nor Fed Chair Jerome Powell may predict when rates start to fall. Inflation must fall toward the Fed’s target rate.
3/ $1.7 Trillion in Government Spending
The Senate passed a $1.7 trillion omnibus funding bill . This is fiscal spending that works against the Fed’s policy. Still, the government is spending $44.9 billion to support Ukraine and NATO. Defense spending is $858 billion.
The heavy spending in the defense and aerospace sector may limit the bill’s impact on inflation in 2023. The government budgeted $772.5 billion for non-defense spending. In effect, the spending should create jobs. This will help the Fed engineer a near recession in 2023 while achieving full employment.
4/ Employment
In November 2022, the unemployment rate did not change from 3.7% . Although the economy likely created more part-time jobs than full-time jobs, the unemployment rate remained steady this year:
BLS
Seasonally adjusted, jobs continue to grow steadily:
BLS
The strong employment suggests that economic activity will not weaken by much in 2023. Workers are absorbing inflationary pressures. In addition, labor force participation of 62.1% did not change by much since early this year. As disposable income worsens, participation rates could rise. This improves output levels.
Underlying companies in the SPY index report quarterly results that are better than expected.
5/ Interest Rates
Investors should work with the assumption of a 5.0% Fed Funds rate. The 1.66% dividend yield on the index is well below the 5% risk-free rate of return.
Investors should watch bond yields closely. In November, the 2-year Treasury yield peaked at over 4.70%. It pulled back to as low as 4.20%. The yield needs to fall before investors may expect the S&P 500 to sustain an uptrend.
CNBC
Risk-free bonds are less attractive when yields fall. The lower yield encourages investors to take risks with equities.
6/ Individual Stocks Considerations
Apple ( AAPL ) has the highest weighting in the SPDR S&P 500 . iPhone output disruptions in Foxconn, located in China, began in October 2022. It will hurt profits in the fourth quarter. At the start of 2023, SPY could fall as investors sell this index.
SPDR top holdings (SPDR)
Investors are likely confident that after Adobe ( ADBE ) reported stronger subscription revenue, Microsoft ( MSFT ) will do so, too. Still, monthly Office 365 rates are creeping higher. Corporations pressured to cut costs may order a lower-tiered 365 service.
Microsoft is also focused on acquiring Activision Blizzard ( ATVI ). Sony ( SONY ) is one of its loudest critics against the deal. Should it fail, Microsoft may avoid the $69 billion price tag. Instead, it would pay a $3 billion break-up fee .
MSFT and AAPL stock represent the tech sector. The markets need to decide if Microsoft is worth the 25.67 times price-to-earnings ratio. Similarly, Apple stock trades at a 21.67 times P/E. Before 2019, Apple stock frustratingly traded at a P/E in the low teens at around 12x.
Amazon ( AMZN ) has the highest risk in my view. The weak holiday sales will hurt the retail sector. Amazon could report the weakest sales growth among the e-commerce firms.
In a five-year chart, AMZN stock is nearing its pre-2020 P/E ratio. I think this could fall to as low as 60 times in 2023.
7/ Charts
Charts are by far the easiest way to forecast a downside target on the S&P 500. Zoom out before the 2020 pandemic on the SPY chart:
The negatively-sloped, moving averages suggest that the index could fall to 3,500 or lower in 2023. The downtrend in 2022 may have enough momentum to send the index to 3,200.
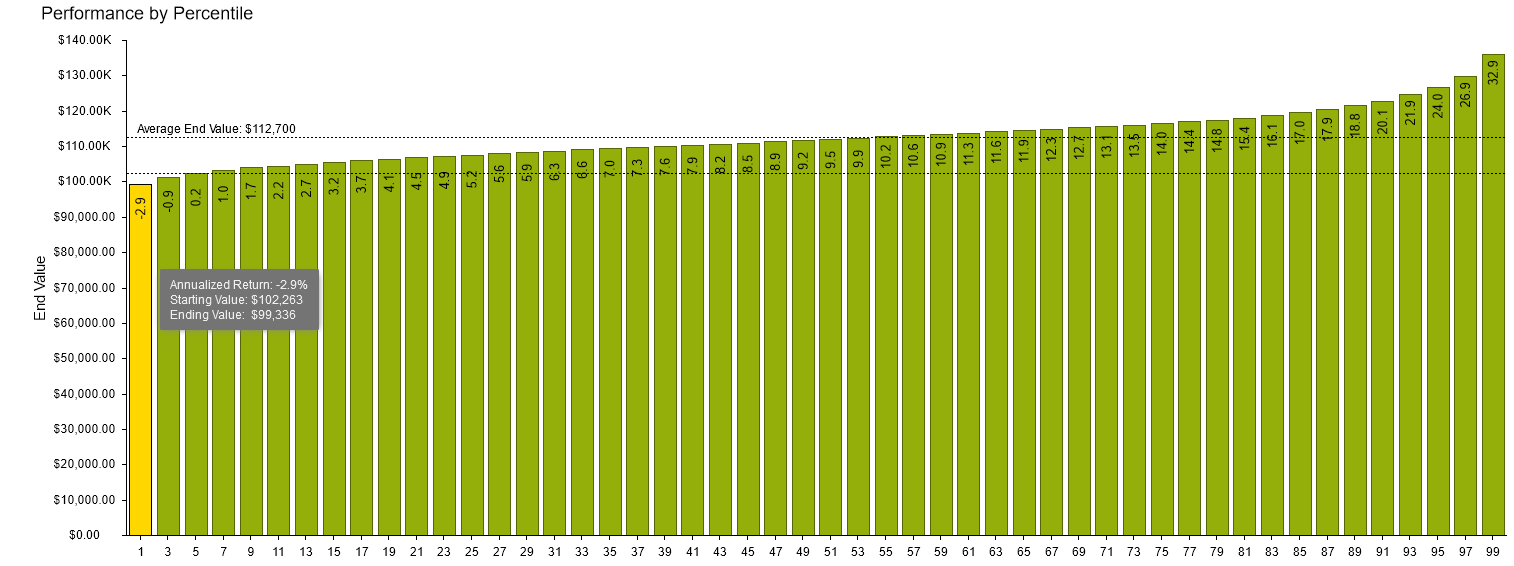
8/ Monte Carlo Simulation
On the SPDR page, I downloaded the SPY holdings . The on Stockrover, I started a Monte Carlo simulation by importing the ETF’s holdings. Then I ran future simulations. In the image below, I assume inflation is at 5.5%. I also chose a sample period near the financial crisis in 2008, selecting the one-year return (simulation years):
Stockrover
When 85% of the months sampled is positive, the annualized return is -2.9%.
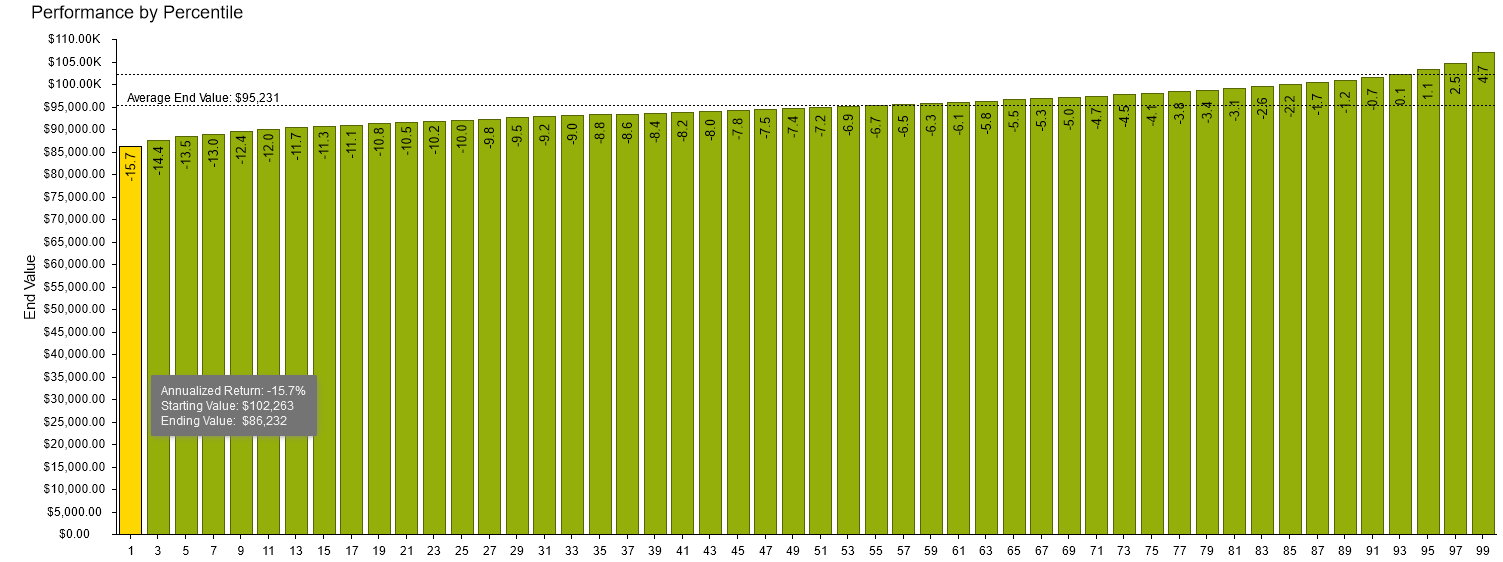
When the model samples only 15% of positive months, the return is -15.7%.
9/ 2023 Profit Forecast and Multiple
For the S&P 500 as a whole, JP Morgan expects EPS in 2023 of $205 , down from its previous $225 forecast. The bank is likely too pessimistic. Companies cut costs to align with lower demand. Led by Apple and Microsoft, I think earnings for the index may fall by 3% or $218.25 .
Assume that the S&P 500 EPS for 2022 is $218.25. At a 17 times valuation multiple estimate, the S&P 500 will close at 3,725 at the end of 2023. This would suggest a slight decline in the index in 2023. This is discussed in the Monte Carlo simulation section.
Risks
The Federal Reserve might end its rate hike schedule earlier than expected. This would send the S&P 500 index higher. Conversely, supply disruptions in China may continue in 2023. Currently, the Covid outbreak is in the early phases. It could peak in March 2023. The supply disruption would increase inflation rates, hurting stocks more than I forecast.
Your Takeaway
My glass is half full and still comes up negative. I am forecasting a mild 2.9% drop or a 3,725 target on the S&P 500 in 2023.
Return to this article next year to find out how far the index closes from my target.
Editor's Note: This article was submitted as part of Seeking Alpha’s 2023 Market Prediction contest. Do you have a conviction view for the S&P 500 next year? If so, click here to find out more and submit your article today!
For further details see:
What A S&P 500 Portfolio Could Be Worth In 2023