XEL - Why I'm Considering Electric Utilities For My Portfolio
2023-05-08 16:21:50 ET
Summary
- Electric utilities are one of my preferred investment choices.
- Recent prices seem stretched for the current environment, but these are considered "safe-haven" choices.
- As a conclusion, I have decided to trade AEP and BKH at the current price range and build a starter position in them.
What attracts me to electric utility stocks for my portfolio?
1. Electric utilities are one of my favorites for my portfolio. The demand for electricity will never end. More than that, the companies already in business have a large business moat. Their businesses cannot be easily replaced. That adds comfort to having them in our investment portfolio for the long haul.
2. Since electric utilities offer essential services, this gives utility stocks highly predictable revenue and cash flow, making them some of the safest investments I can make in this higher-risk environment.
3. Moreover, climate change and green energy methods of production demand huge investments. With the investment demand, the regulators are willing to approve rate increases, which in turn provide the required growth at a fair return to the investors. And that comes in the form of regular dividend increases.
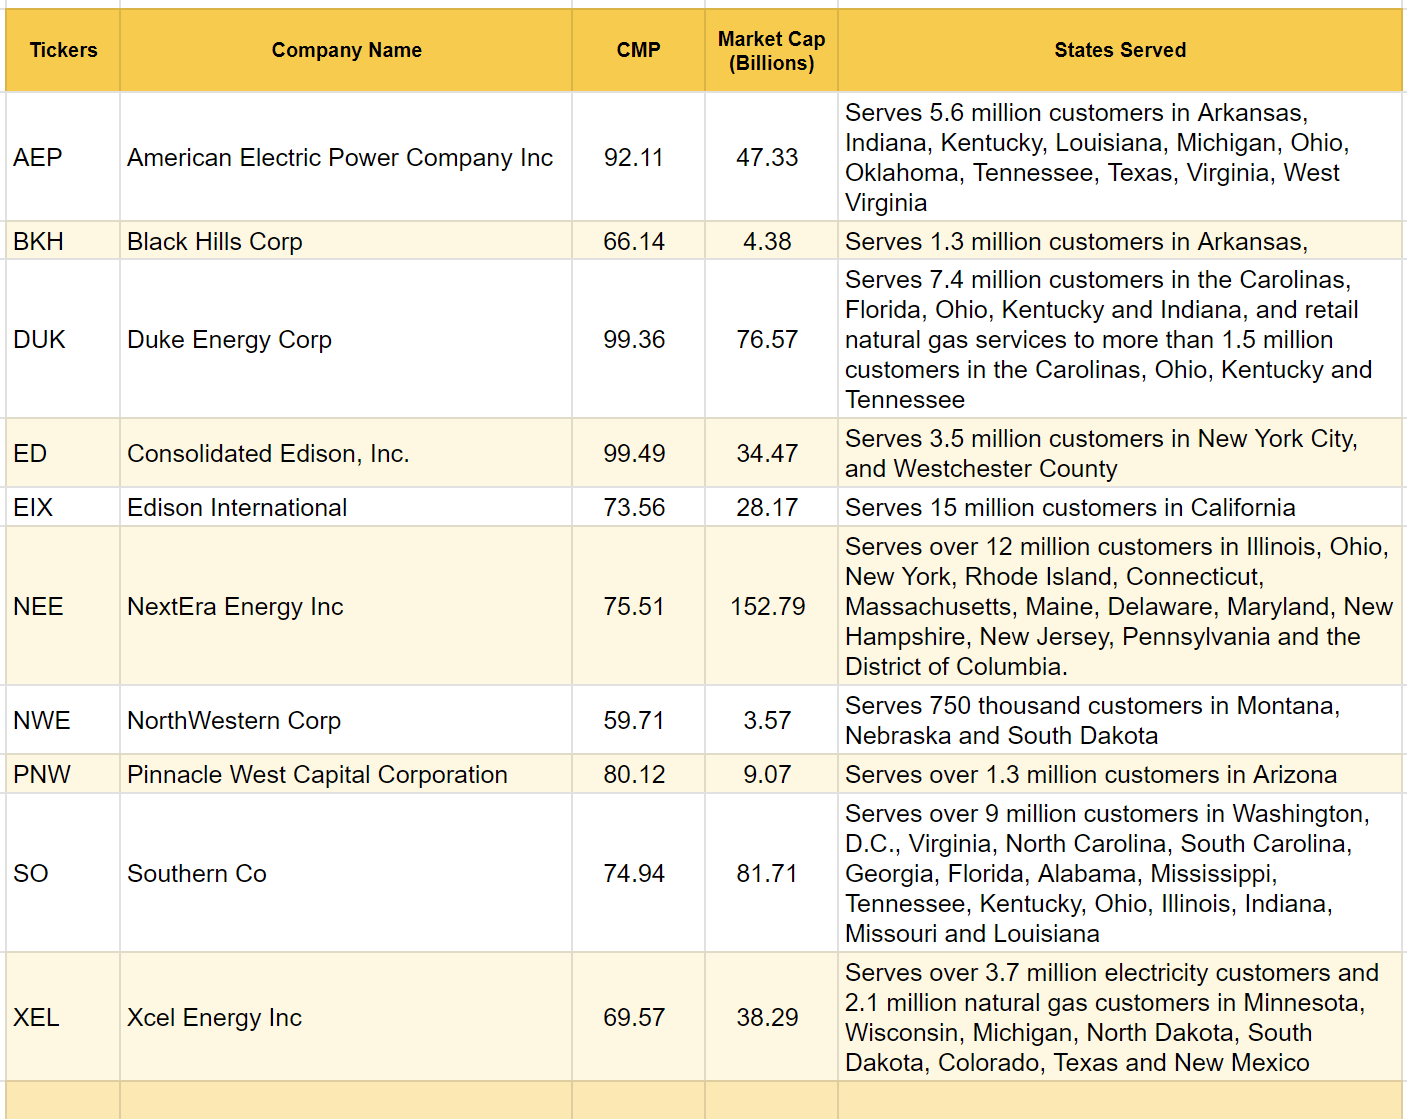
The electric utility picks in this study:
My Utility Picks (Authors Compilation)
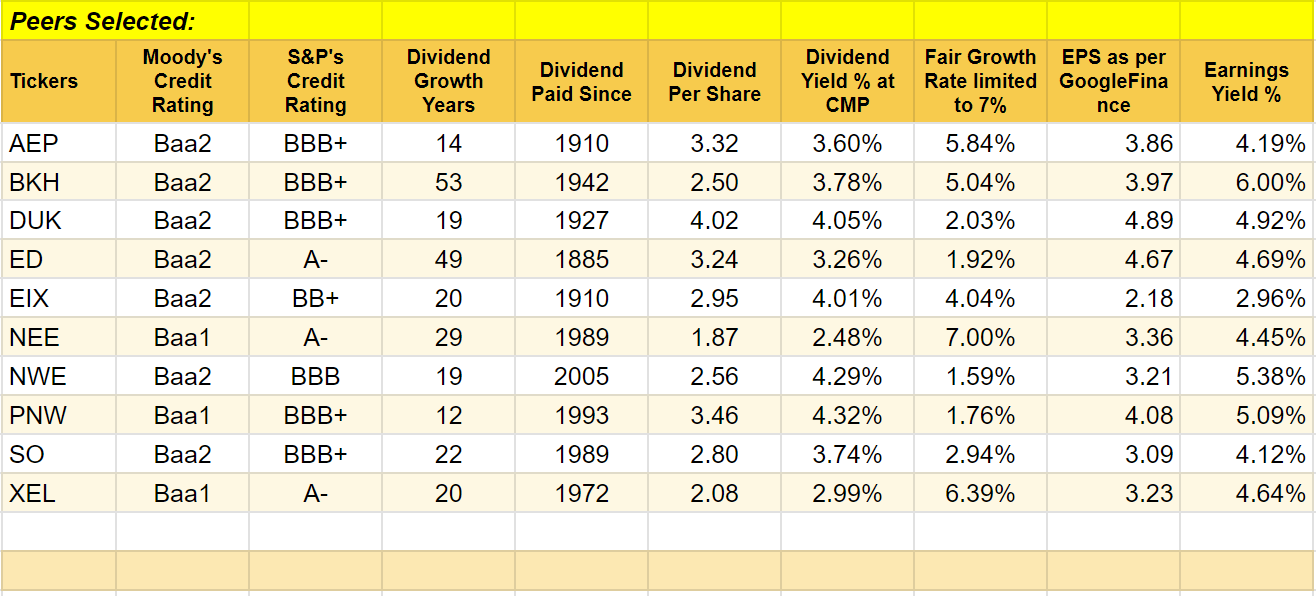
Credit ratings and dividend history:
I limited my study to ten of the electric utilities selected. Let me first provide some historical data for a side-by-side comparison. These comparisons are only from an investment perspective, mostly limiting the study to my dividend income requirements. All these have the required investment-grade credit ratings. These have demonstrated the ability to distribute dividends for fairly long periods.
Historical Data (Author Compilation)
Earnings yield is the earnings the company makes per share at the current market price, expressed as a percentage. If I have to buy the shares at the current market price, my buy is likely to earn this earnings yield percentage for the money I pay. A PE of 15 is considered fair, and that works out to an earnings yield of 6.66%. I am not happy that the traditional fair PE of 15 is fair in an inflationary and earnings-dwindling situation. I believe that will be the situation going forward, with interest rate hikes to come and cost inflation.
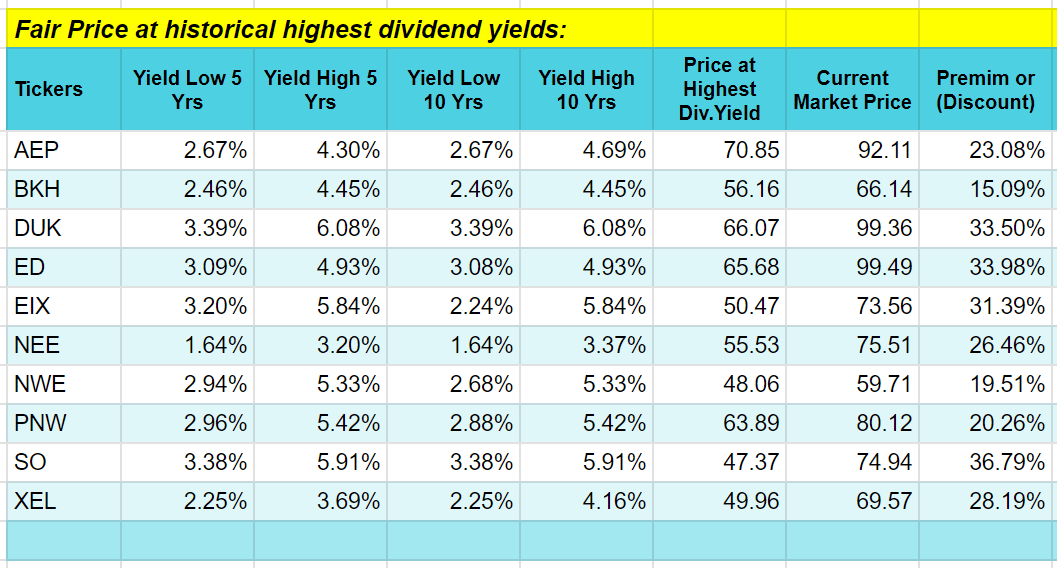
Fair price at the historical highest dividend yields:
These are expensive "safe-haven" investments. When market fear decreases and greed mounts, these investments get disinvested, and money finds stocks in other industries. The high and low prices recorded in the past, along with their dividend yields at those prices, give us a fair amount of price ranges when the market finds these utilities more attractive to buy or less attractive to not own them anymore. A fair price range to buy and own these utilities can thus be worked out with past historical data.
Fair Price at historical highest dividend yields (Authors compilation)
The "Price at Highest Dividend Yield" in the table indicates a probable price at which the current dividend rate can be bought if fear drives the market to sell off these utilities. I would call this a fair price based on the historically high yields. Caution: The fresh dividend increases can drive the yield higher, and hence waiting for such rates might end in futility.
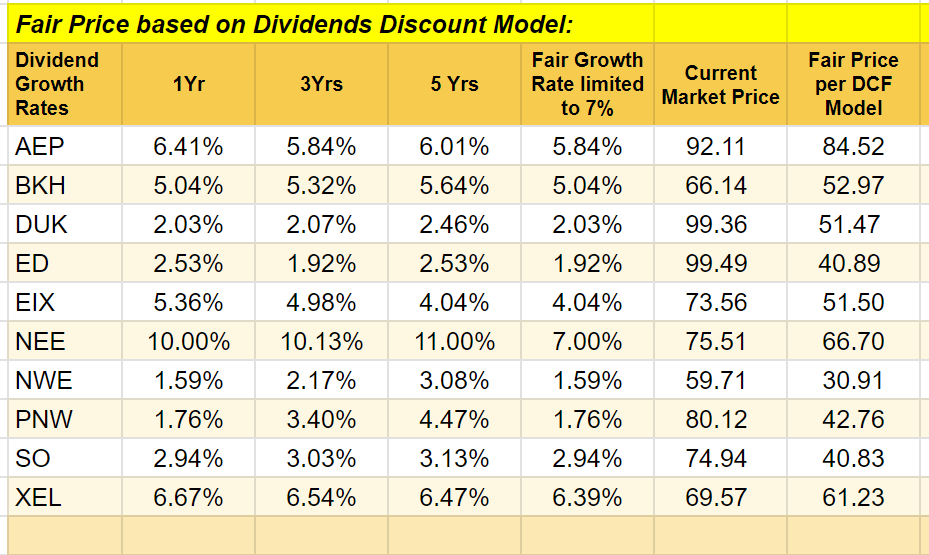
Fair price based on the dividend discount model:
According to Investopedia :
"The dividend discount model ((DDM)) is a quantitative method used for predicting the price of a company's stock based on the theory that its present-day price is worth the sum of all of its future dividend payments when discounted back to their present value. It attempts to calculate the fair value of a stock irrespective of the prevailing market conditions and takes into consideration the dividend payout factors and the market's expected returns. If the value obtained from the DDM is higher than the current trading price of shares, then the stock is undervalued and qualifies for a buy, and vice versa."
We have to know the dividend growth rates for the future to calculate this. Since the future is uncertain, I would use the past year's dividend growth rate, the past three years' dividend growth rates, and the past five years' dividend growth rates and average them. What if the growth rates are not sustainable going into the future? Specifically, if such growth rates are very high, I would like to limit this to a maximum of 7% in my calculations. Reasoning: The company's growth phase might end, and then the normal mediocre growth rates could happen. Considering the green energy concepts and the need to discontinue the use of fossil fuels, these companies will have to invest heavily in the near future. The government has to agree to rate increases that can provide reasonable returns to investors for capital formation. Hence, I assume the past historical dividend increases will continue, but limit it to 7%. I would discount the future dividend stream by 10% to arrive at the present value. With these explanations, I am presenting the fair prices in the following table:
Fair Price - DDM (Author compiled)
Fair price based on dividend payback years:
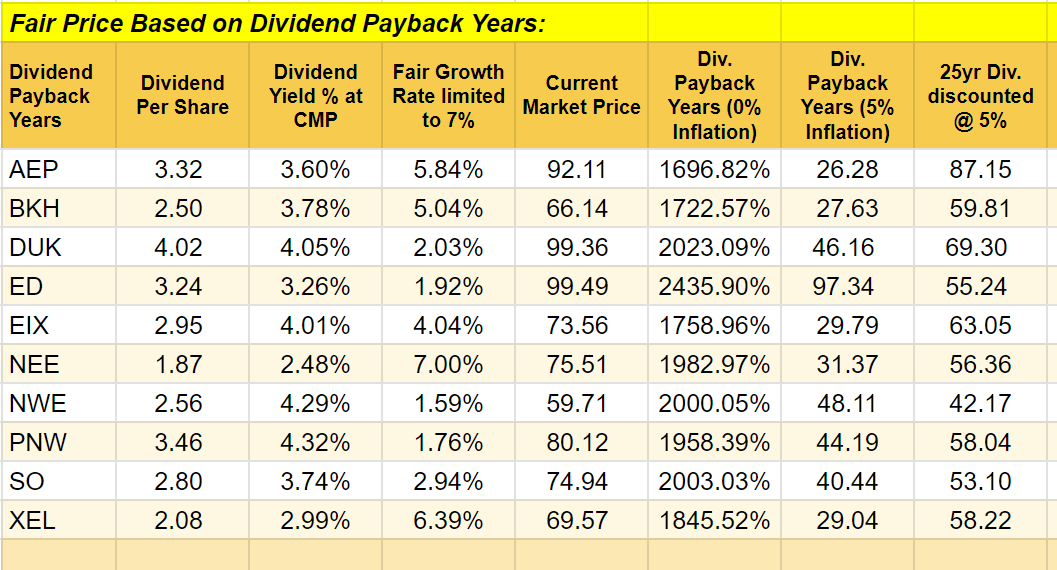
I would also like to find a fair price in another way. The sum of the future dividends I will collect in the next 25 years, discounted at inflation rates, can give an idea of the fair value of a stock. While the discount rate of 10% I used in the DDM model is replaced with 5%, which is the average future inflation rate, I also want to limit the dividend steam period to the next 25 years instead of all future dividends in the DDM model. In accounting terminology, this is a version of the dividend payback years. The dividend payback period is the number of years it will take to receive back today's cost as dividends discounted at an expected rate of return. If one buys the shares at the current market price, the money value will be returned as dividend streams in "n" number of years going forward. If I buy AEP, which grows dividends at a 5.84% average rate, or BKH, which grows dividends at a 5.04% average rate, I will get back what I paid at today's buy price in approximately 27 years of dividends I collect, adjusted for inflation. Now, what if I want to limit my buying price to such an amount that I collect back the same amount as a dividend stream adjusted for inflation in 25 years? The data in the following table shows that.
Fair Price Based on Dividend Payback Years (Author compiled)
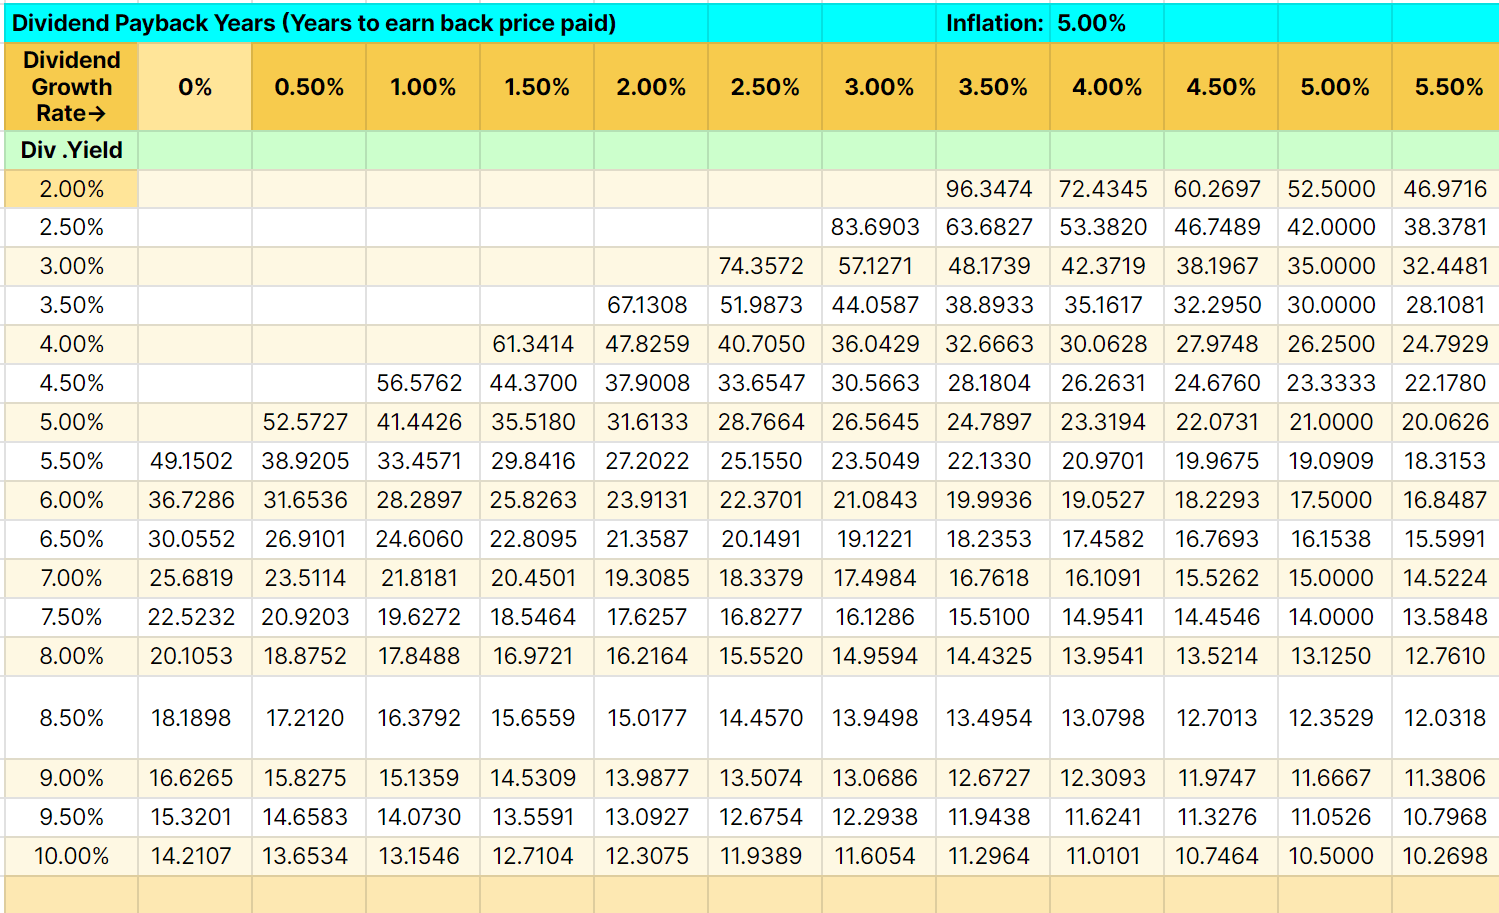
As an important message, dividend yield at the purchase price and dividend growth are both very important factors for a successful investment. Chasing dividend-growth stocks at any price is a mistake. In the same way, for a long-term investment, a high dividend yield should not be a deciding factor. The following table illustrates that.
Dividend Growth Vs Dividend Yield (Author compiled)
A 10%-yielding stock with zero percent dividend growth can recover the price paid as a stream of dividends in 14.211 years, even though the money value received year after year declines at inflation rates. A 5.5% dividend growth share yielding 3.5% at the purchase price will take 28.10 years to recover its purchase price. If these growth rates remain the same for 50 or 100 years, the next generation's inheritor could benefit far more than the 10%-yielding stock. One cannot project the dividend growth rates for such a longer period more accurately. Hence, prudence in selecting the rate at which we purchase our investments is very important. One can mention that a fast-growing dividend can grow its value much higher. There is some truth in it, but prudence rather than impulse is required to grow that value much higher by buying at a fair price.
Summing it all up:
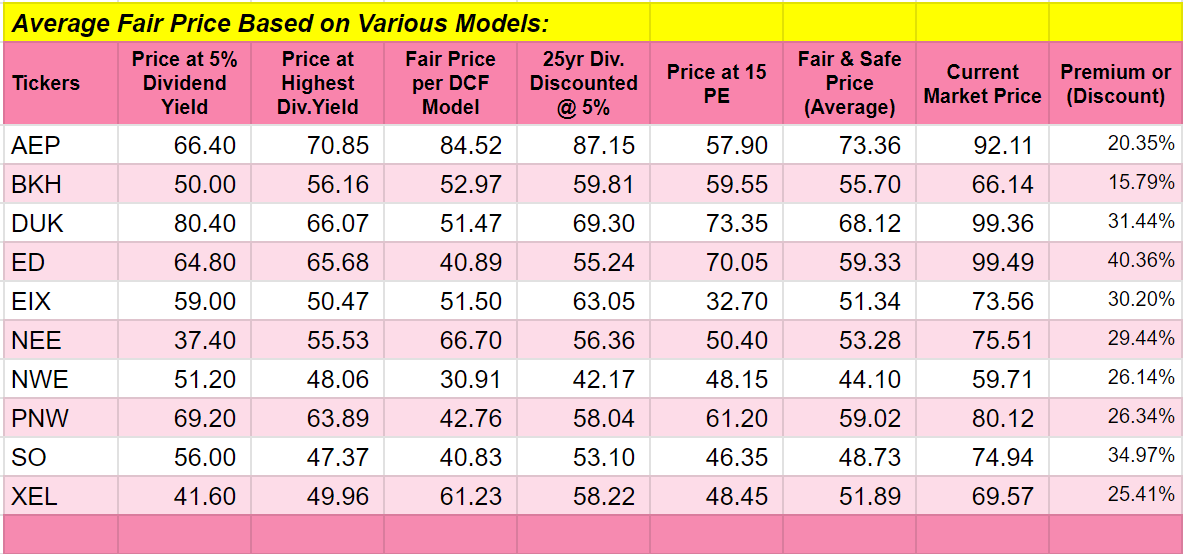
I provided three different ways to find a fair price for these utilities. Since utilities are what I'd call safe-haven investments with a need for heavy investments, I will find a fair price for them using a dividend yield of 5% as my fair buy price. And yet another way to estimate their fair price is to use 15 PE multiples. And then an average of all these five methods is listed in the following table:
Average Fair Price (Author Compiled)
Conclusion:
All the utilities are showing stretched valuations as of now. But in reality, fair buy prices may or may not happen in the near future. Waiting with this type of projected price may or may not help me take any positions for my portfolio. But I am concerned about paying a high price as well. This has led me to do a lot of trading in my preferred stocks, one or a few at a time. The gains are adjusted against the costs to make my net holdings cash flow at much lower rates. Generally, I aim to retain sufficient quantity to make the net gain adjusted cash flow cost earn a 10% dividend yield. While this cannot be achieved overnight, the starting positions tend to cost a maximum of the estimated fair price. Readers might be interested in reading how I am building my current new portfolio by clicking on My New Portfolio Building Process or the general concepts I follow in depth by clicking on My Perennial Income Portfolio .
From the last table above, one can notice AEP and BKH are much closer to the fair prices projected. That is why I have decided to trade AEP or BKH at current prices more frequently and build my initial position .
For further details see:
Why I'm Considering Electric Utilities For My Portfolio