SLB - Why Now Is The Time To Invest In Oceaneering International The Leading ROV Provider
2023-03-27 14:43:58 ET
Summary
- As the foremost supplier of remotely operated vehicles (ROVs), Oceaneering stands out as a pure-play vendor in the offshore oilfield service sector.
- In this article, I aim to analyze Oceaneering's current business cycle through operational and financial data and assess the risk-reward profile of the stock.
- Based on my analysis, it may be a good time for long-term investors to consider investing in Oceaneering.
Over the past three years, I have been long oilfield services, a section of the oil and gas industry as represented by the VanEck Vectors Oil Services ETF ( OIH ). Specifically, I recommended investing in large-cap companies Schlumberger Limited ( SLB ) and Halliburton Company ( HAL ) in a previous article . The investment thesis has played out well so far and remains valid. Additionally, I suggested small-cap oilfield service companies as potential growth opportunities, such as Canadian firms Total Energy Services Inc. ( OTCPK:TOTZF ), Trican Well Service Ltd. ( OTCPK:TOLWF ), Cathedral Energy Services Ltd. ( OTCPK:CETEF ), and STEP Energy Services Ltd. ( OTCPK:SNVVF ). These recommendations have performed satisfactorily overall, which I believe is because I followed the value investing principle in selecting stocks, as I discussed in detail in interviews with Seeking Alpha in 2021 and 2022 .
You may have noticed that my stock picks, as listed above, do not include any offshore oilfield service pure-plays. However, offshore upstream activities have shown an uptick in recent quarters, indicating that it's probably time to consider high-quality offshore oilfield service stocks. In this article, I would like to examine Oceaneering International ( OII ) and determine whether its operational performance justifies an investment at this time.
Oceaneering: an overview of the business
Oceaneering, based in Houston, is a leading provider of remotely-operated vehicles (ROVs), which are underwater robots used to perform tasks and collect data in depths ranging from 300m to 6,000m. These robots are controlled by an operator on the surface using a tether or umbilical cord.
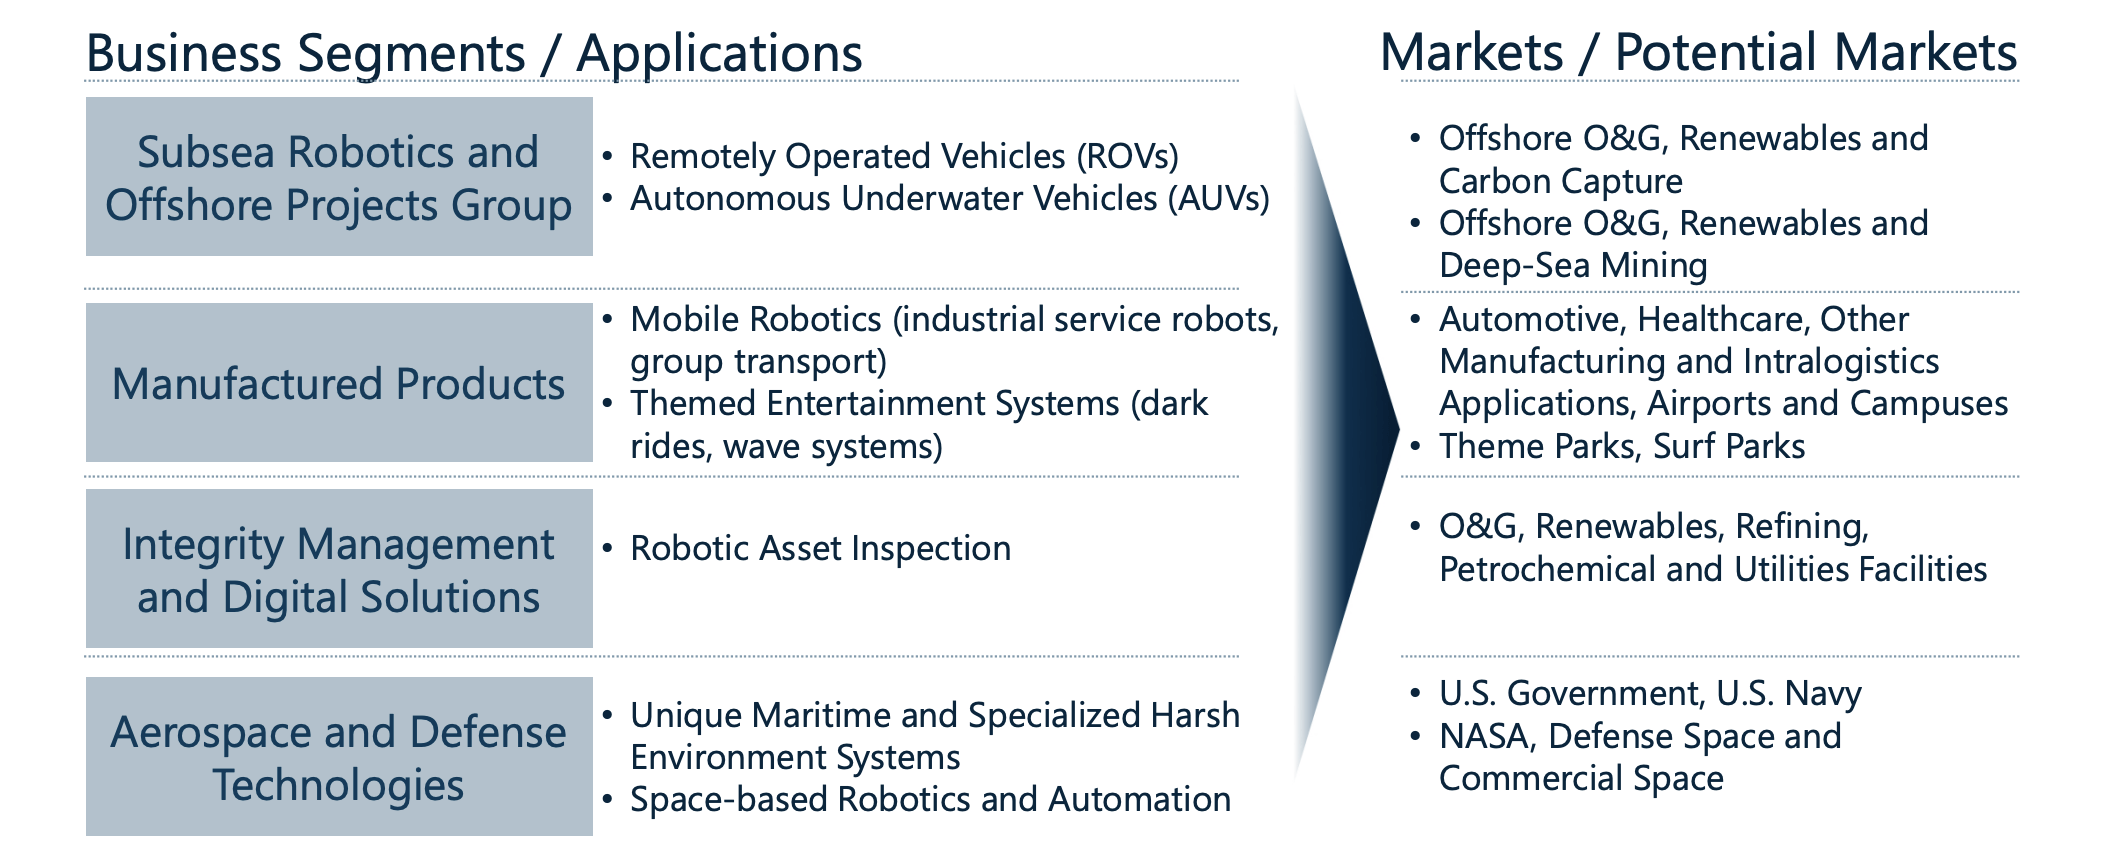
Although Oceaneering first gained recognition for its ROVs in offshore oil and gas operations, the company has since expanded its offerings to include the manufacturing of various robotics products such as production control umbilicals, field development hardware, pipeline connection and repair systems. Additionally, Oceaneering provides project services such as subsea installation and intervention, as well as conducting robotic asset inspection, as shown in Figure 1.
Furthermore, Oceaneering has leveraged its expertise to serve government clients in the defense and aerospace industries.
Fig. 1. Oceaneering has parlayed its robotics expertise to serve multiple markets (Oceaneering)
In 2022, Oceaneering had 9,200 employees and generated $2 billion in revenue. The stock is a component of the VanEck Vectors Oil Services ETF.
Oceaneering is highly regarded by its loyal customers for its unique technical expertise. However, as a business operating in a cyclical industry, it's important for investors to identify the optimal time to enter the stock.
Business cycle
Since reaching the Covid-19 bottom in early 2020, Oceaneering's ROV fleet has stabilized at around 22,800 available days for 12 consecutive quarters, with ROV utilization fluctuating around 60%, as shown in Figure 2. However, unlike in 2012-2014 - during the height of the last oil bull market - when it expanded its ROV fleet, Oceaneering has not done so recently, and its current ROV utilization of approximately 60% is significantly lower than the previous high of around 86% reached in late 2013 and early 2014. These data suggest that offshore upstream activities have not significantly improved, and the oil bull market is still in its early stages.
Fig. 2. ROV days available and ROV utilization at Oceaneering (compiled by Laurentian Research for The Natural Resources Hub based on data released by Oceaneering)
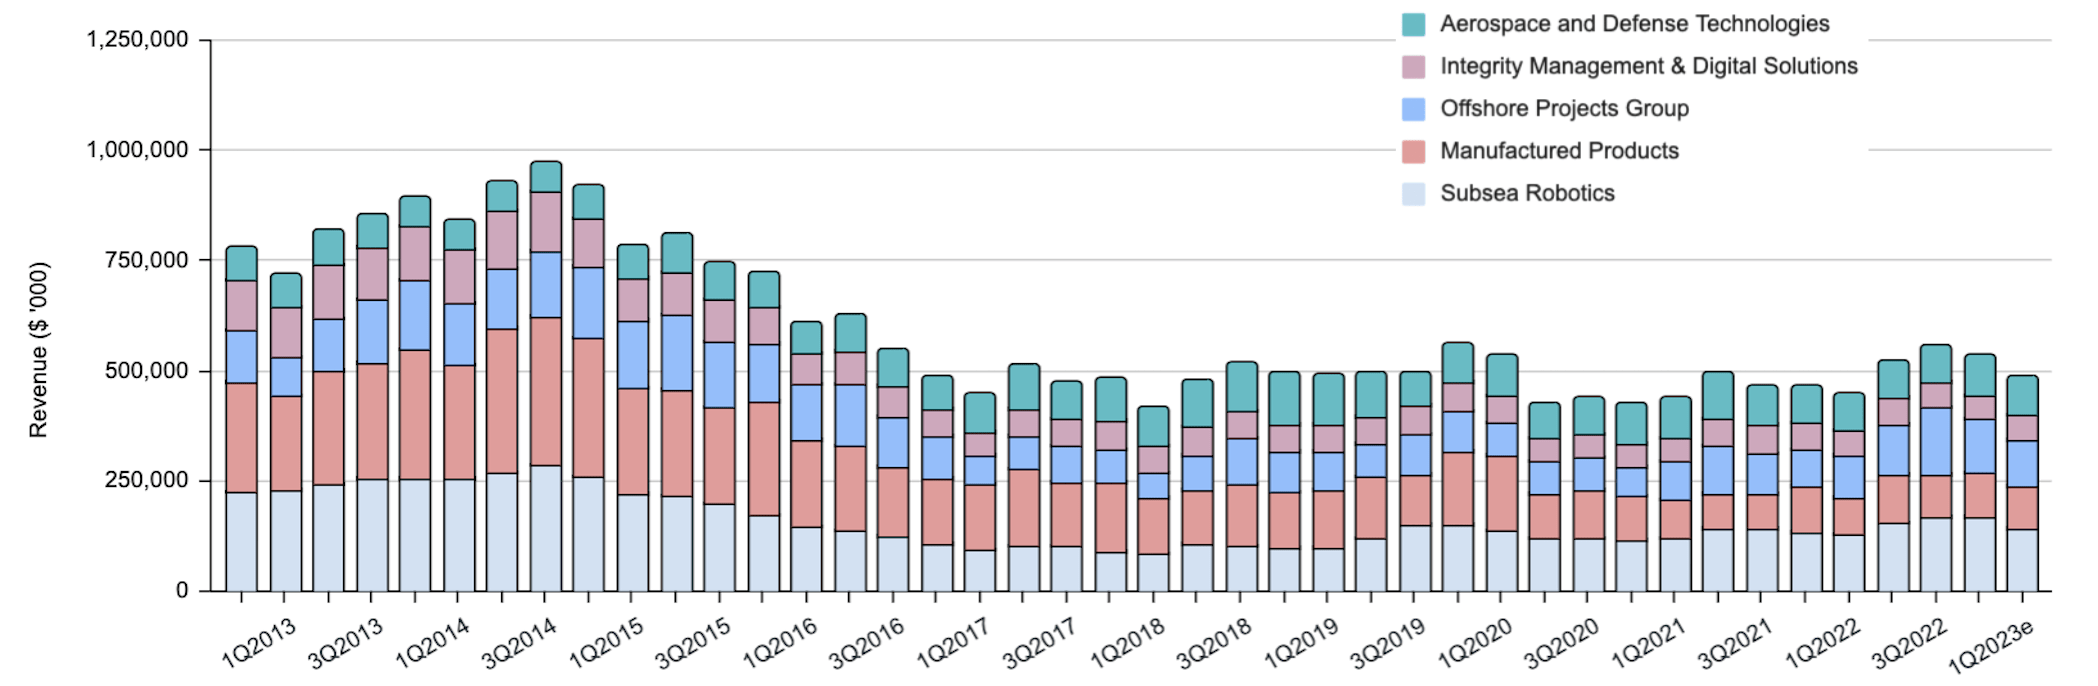
As a result, revenue in 2022 was only at approximately half the levels that were reached during the peak of the last oil bull market, as illustrated in Figure 3.
Fig. 3. Quarterly revenue of Oceaneering by business segments (compiled by Laurentian Research for The Natural Resources Hub based on data released by Oceaneering)
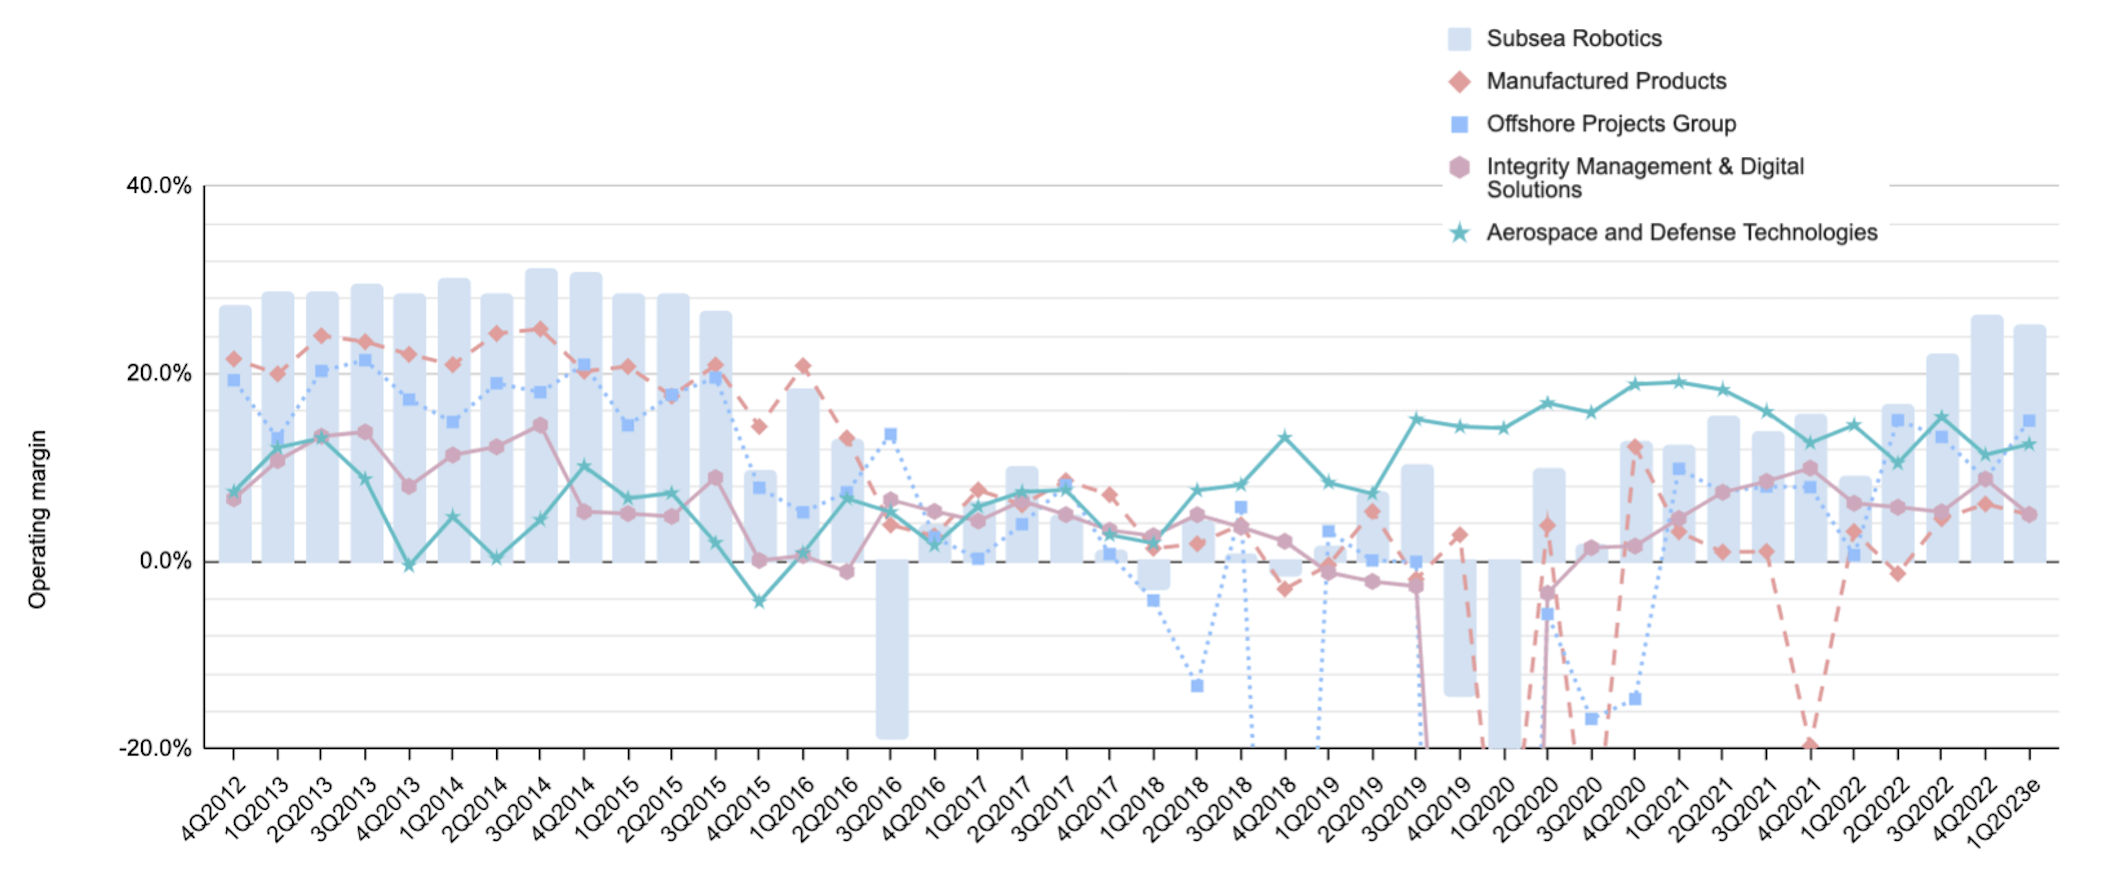
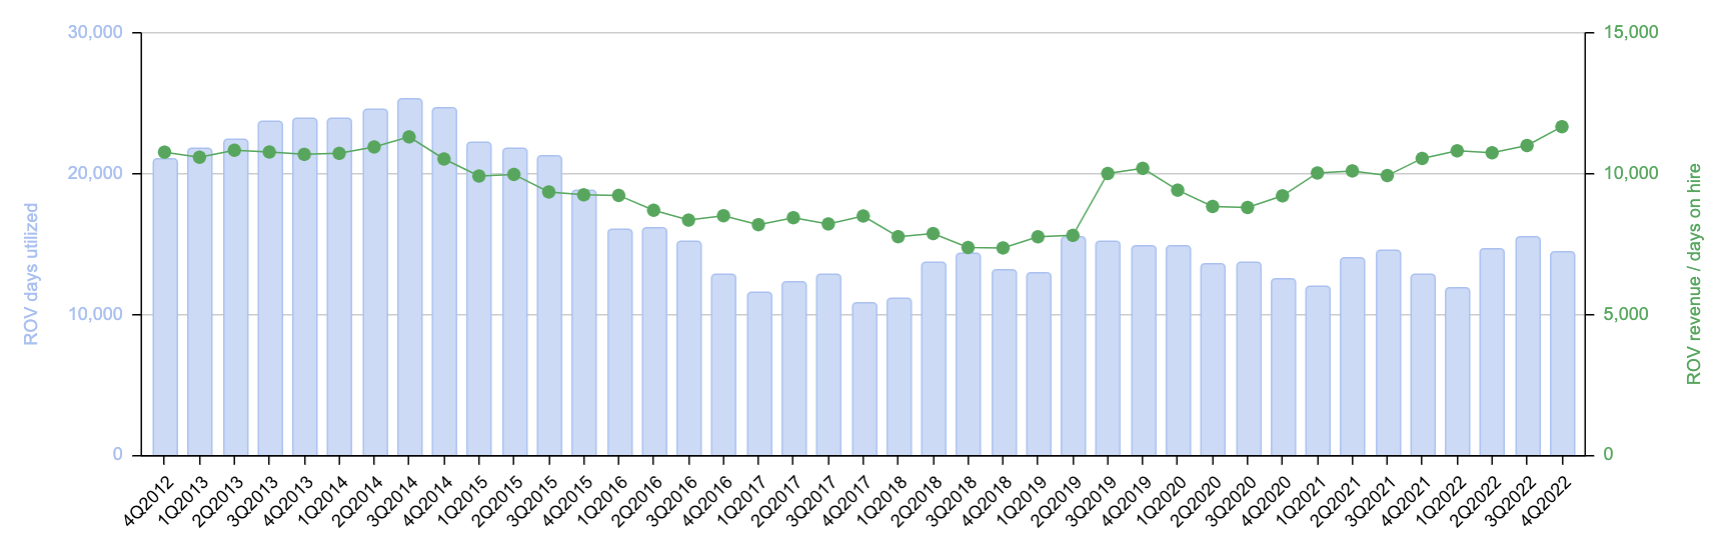
Figure 4 illustrates the operating margin history for Oceaneering's five business segments. Despite the observations mentioned earlier, the operating margin for the subsea robotics segment, which accounts for approximately 30% of total revenue, has continued to improve thanks to a steady increase in ROV day rates, as shown in Figure 5. Additionally, the aerospace and defense technologies segment has remained profitable even during the Covid-19 crisis, contributing to the company's operational resilience. The other business segments have also seen some improvement in their operating margins in recent quarters.
Fig. 4. Operating margin of Oceaneering by business sector (compiled by Laurentian Research for The Natural Resources Hub based on data released by Oceaneering)
Fig. 5. Oceaneering ROV days utilized and ROV revenue / days on hire (compiled by Laurentian Research for The Natural Resources Hub based on data released by Oceaneering)
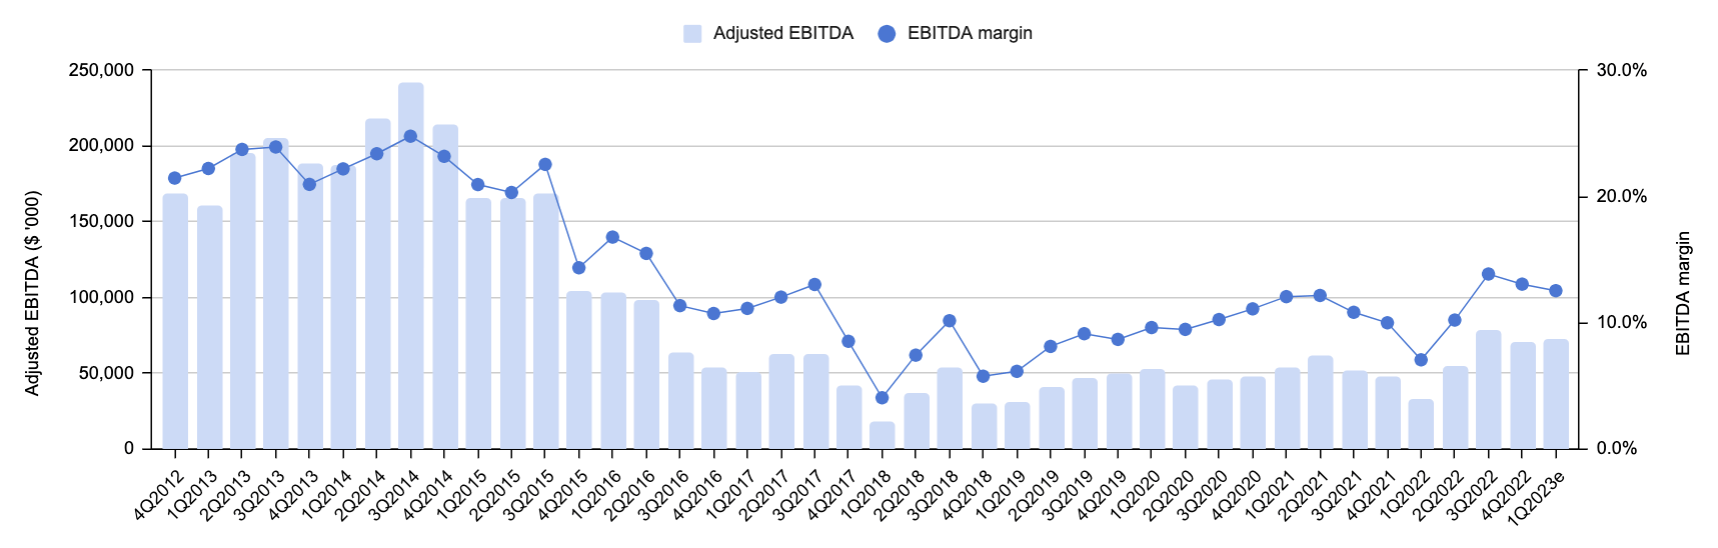
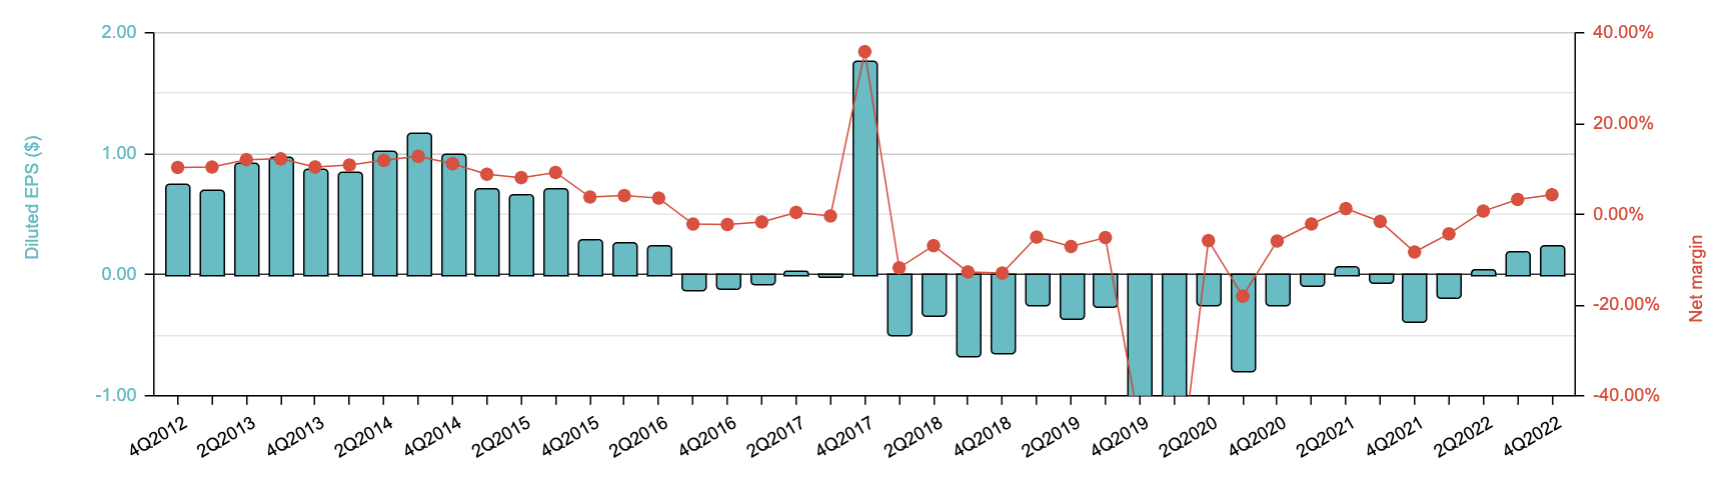
There are also signs of recovery in Oceaneering's EBITDA margin, which reached a six-year high in late 2022, as shown in Figure 6, and in its earnings per share, which remained positive for three consecutive quarters, as illustrated in Figure 7. Moreover, the company has generated free cash flow for four consecutive years, as evidenced in Figure 8.
Fig. 6. Adjusted EBITDA and EBITDA margin of Oceaneering (compiled by Laurentian Research for The Natural Resources Hub based on data released by Oceaneering)
Fig. 7. Diluted earnings per share and net margin of Oceaneering (compiled by Laurentian Research for The Natural Resources Hub based on data released by Oceaneering)
Fig. 8. Free cash flow and FCF margin of Oceaneering (compiled by Laurentian Research for The Natural Resources Hub based on data released by Oceaneering)
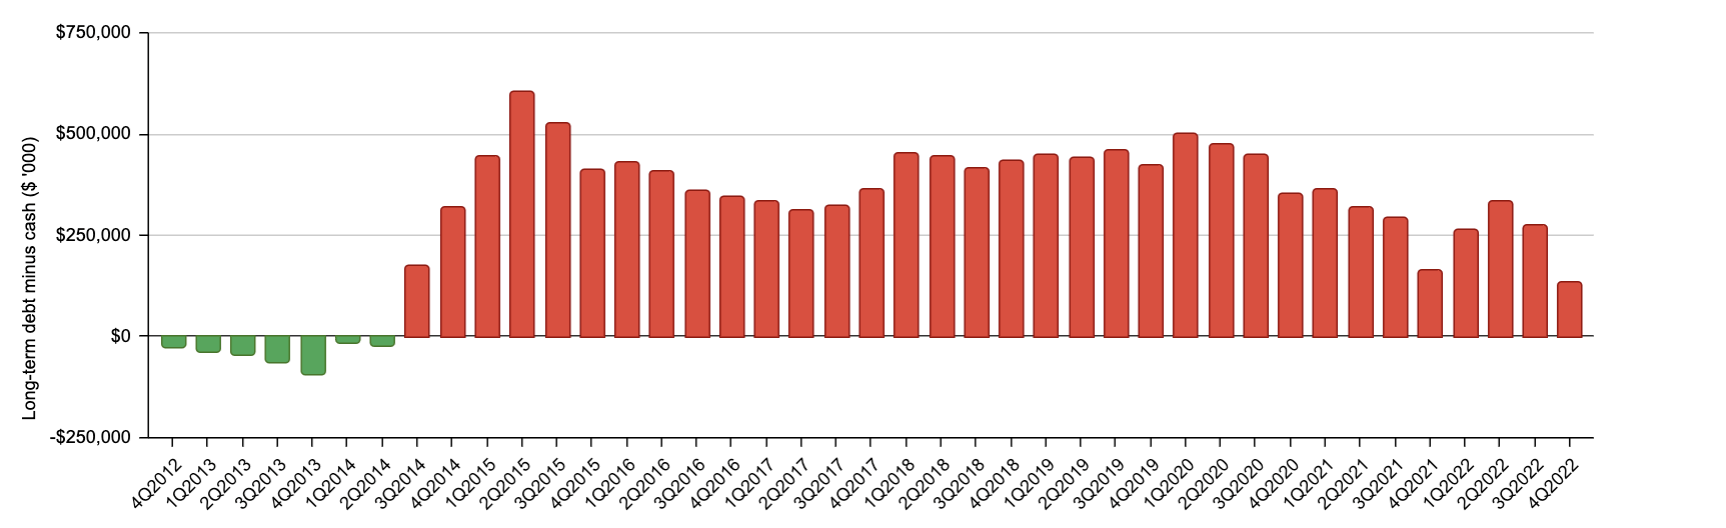
Thanks to its robust free cash flow, Oceaneering has continued to pay down its debt and has built a strong cash position, as shown in Figure 9. As a result, the company's balance sheet is now in the healthiest shape it has been in eight years.
Fig. 9. Long-term debt minus cash for Oceaneering (compiled by Laurentian Research for The Natural Resources Hub based on data released by Oceaneering)
Outlook
The backlog of manufactured products has continued to increase since the beginning of 2021 and has recently rebounded to over half the levels reached during the previous peak in late 2013 and early 2014, as depicted in Figure 10. This indicates that the offshore E&P industry is steadily recovering, albeit at a slow pace, and suggests that stronger financial performance is on the horizon.
Fig. 10. Backlog of manufactured products at Oceaneering (compiled by Laurentian Research for The Natural Resources Hub based on data released by Oceaneering)
According to its 4Q2022 earnings report , Oceaneering seems optimistic about 2023:
"Based on 2022 year-end backlog, the expected meaningful increase in backlog conversion, anticipated 2023 order intake, and current market fundamentals, we are projecting our 2023 consolidated revenue to grow by more than 10%, with increased revenue in each of our operating segments, led by manufactured products and [subsea robotics]...
For the full year 2023, we anticipate generating $260 million to $310 million of EBITDA... At the midpoint of this range, our 2023 EBITDA would represent a 23% increase over 2022 adjusted EBITDA. We anticipate our full year 2023 to yield positive free cash flow of $75 million to $125 million. Based on current market conditions, we expect good opportunities for improved pricing and margins in our energy-focused businesses and stable pricing and margins in our government-focused businesses... We forecast our capital expenditures will total between $90 million to $110 million in 2023."
Valuation and risks
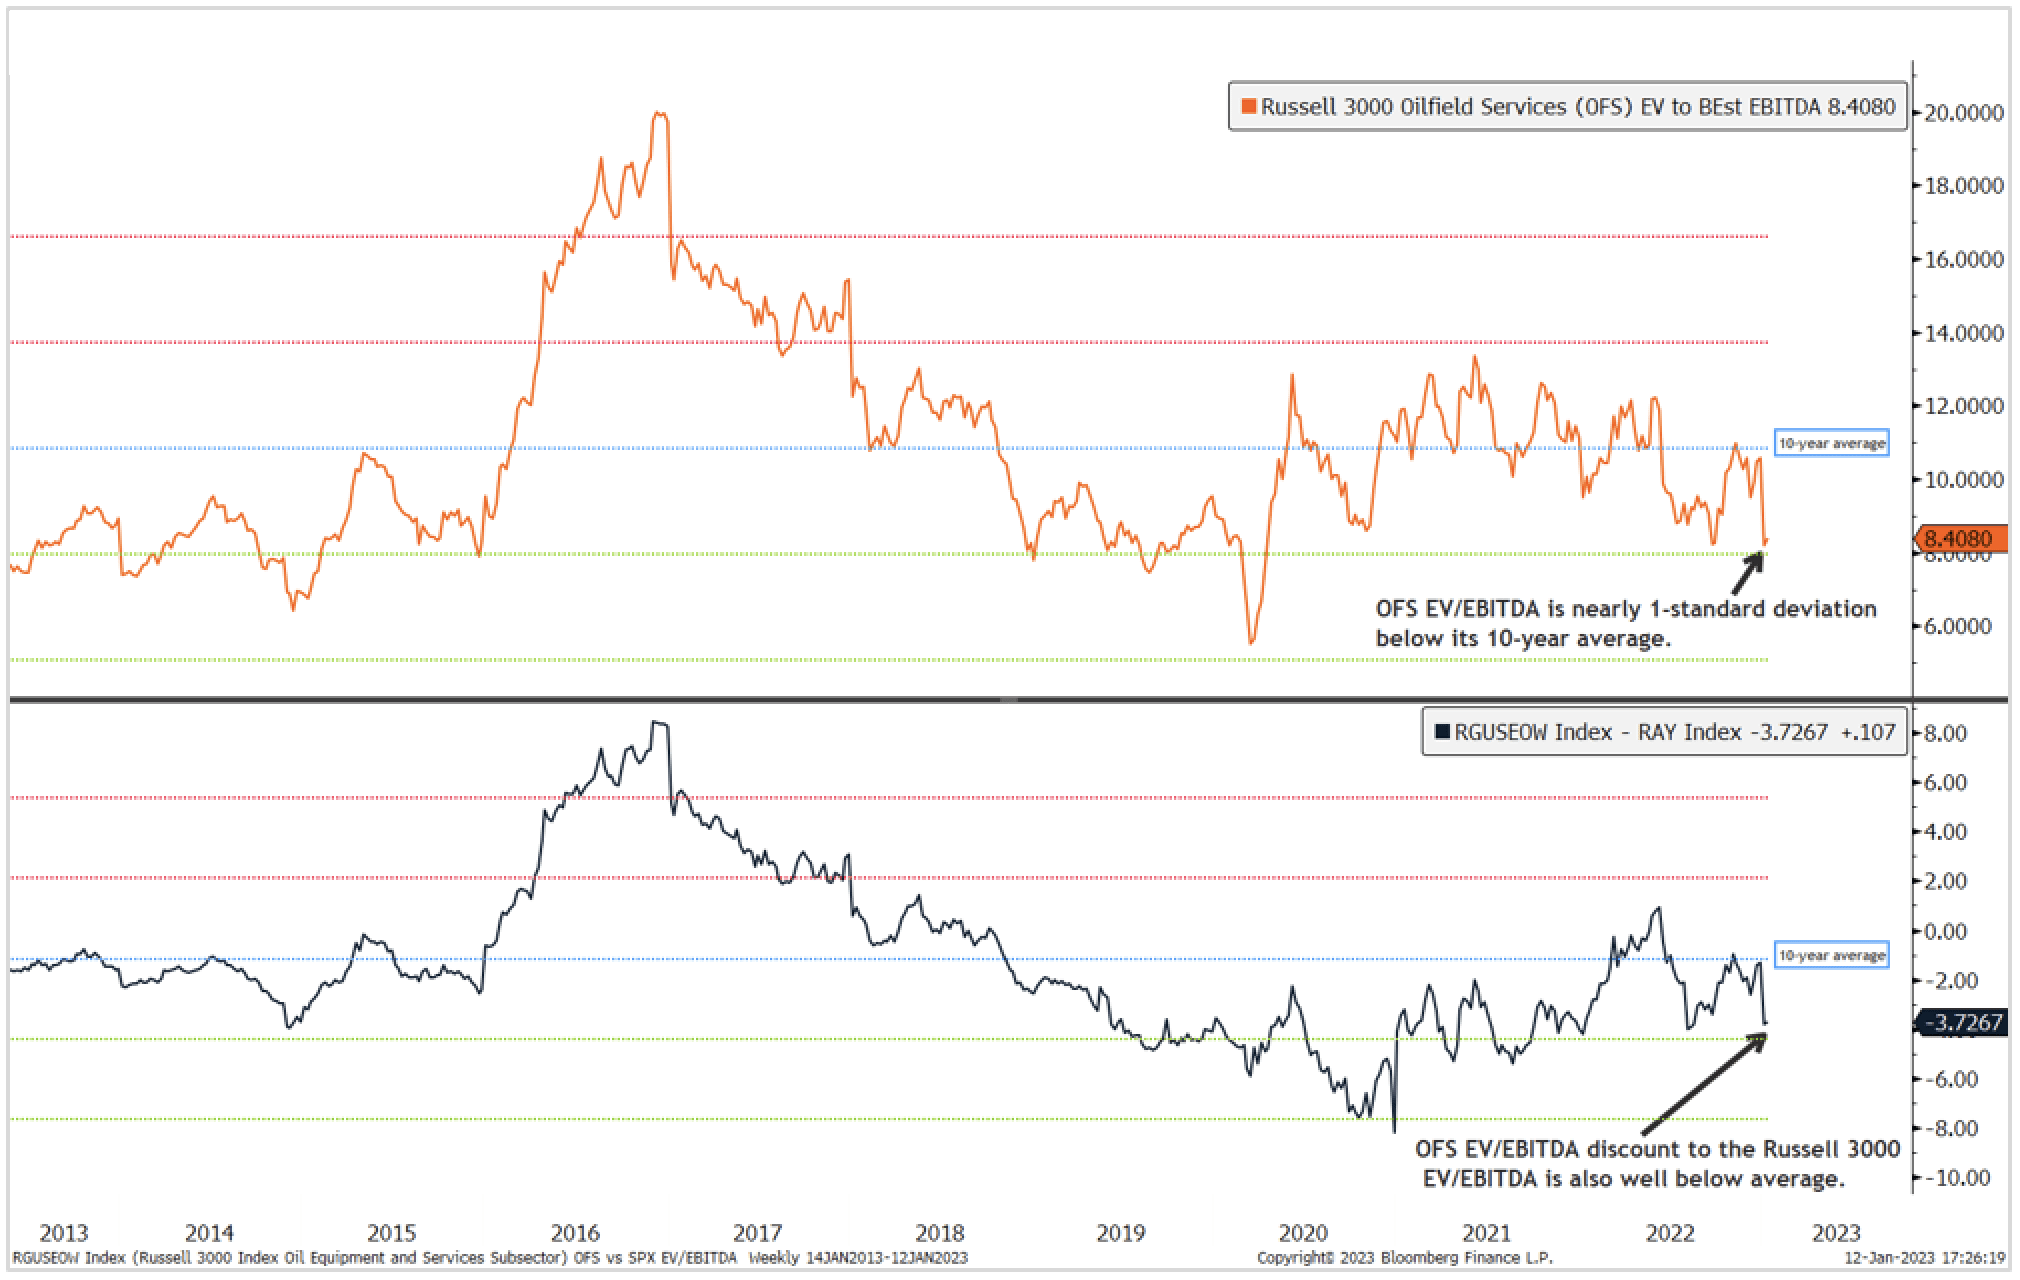
Figures 11 and 12 indicate that the oilfield service sub-industry currently has an EV/EBITDA multiple of 7.8-8.4X. Oceaneering's currently trading at 6.8X of 2023 EBITDA and is at a discount to the industry average. If Oceaneering's EV/EBITDA increases to 8.1X, the stock could reach a target price of $17.80-$21.80, which implies an upside of 10-35% from its current share price of $16.19. In the best-case scenario, if Oceaneering achieves an EBITDA multiple of 10.7X, the 10-year average of the oilfield service sub-industry , the stock could trade at $24.50-$29.70, representing an upside of 51-84% from its current share price.
Fig. 11. Russell 3000 Oilfield Services EV/EBITDA multiple, as of January 2023 (modified from LPL Research)
Fig. 12. Enterprise value multiples by sector in the U.S. in terms of EV/EBITDA vs. EV/EBIT variations, as of January 2023 (compiled by Laurentian Research for The Natural Resources Hub based on data from Aswath Damodaran)
The primary risk to the upside potential described above is a potential slowdown or collapse of offshore exploration and production (E&P) activities if crude oil prices crash. However, given the current strong global oil demand and weak production growth outlook , it is unlikely that offshore upstream operations will slow down anytime soon. In fact, Oceaneering expects a significant increase in backlog conversion in 2023.
For further details see:
Why Now Is The Time To Invest In Oceaneering International, The Leading ROV Provider