RTX - XAR: An Excellent Defense ETF To Benefit From A Rejuvenated NATO
2023-07-24 05:47:15 ET
Summary
- Russia's war on Ukraine has strengthened the NATO alliance and led to increased defense spending, benefiting the aerospace and defense sector.
- State Street Global Advisors' SPDR S&P Aerospace & Defense ETF is recommended for investors due to its strong performance and reasonable expense fee (0.35%).
- The fund holds 32 companies, with the top holdings including TransDigm Group, Howmet Aerospace, and Huntington Ingalls Industries.
- The XAR ETF has a life-of-fund average annual return of 15.8%.
Russia's unprecedented and unprovoked war-on-Ukraine has rejuvenated the NATO alliance and brought in two new members: Finland, which shares an 830 miles border with Russia and which has been "neutral" for decades, joined NATO back in April. Sweden is expected to join as soon as Turkey ratifies Sweden's application - which should happen soon. Meantime, long standing members of the alliance have committed to increased defense spending going forward. All of this is good news - not only for the security of global Democracies, but also for the Aerospace & Defense sector. That being the case, investors should consider allocating some capital to the State Street Global Advisors' SPDR S&P Aerospace & Defense ETF ( XAR ). This is an equal-weight fund that has an attractive long-term performance track record (10-year average annual return of 13.5%) and a reasonable expense fee of 0.35%.
Investment Thesis
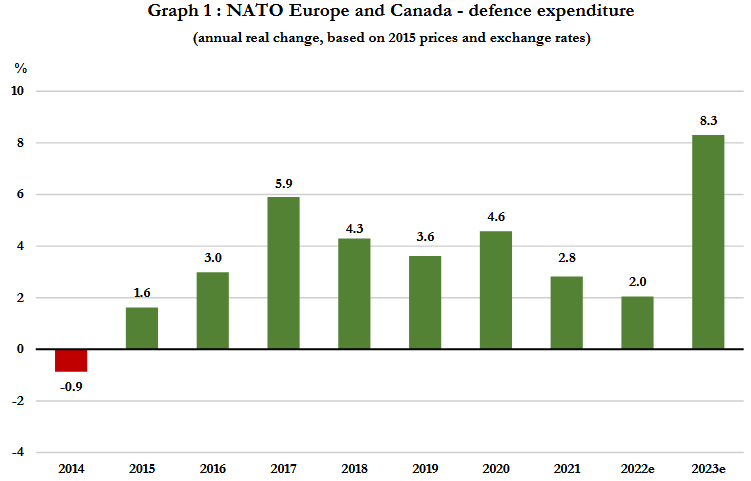
As mentioned previously, Russia's unprovoked attack on Ukraine has led to a rapid strengthening of the NATO alliance. Unlike the previous administration, and under the leadership of U.S. President Biden, the existing NATO alliance was brought back together and stronger than ever and will soon add its second new member since Russia's invasion - Sweden. Earlier this month, NATO announced EU & Canadian defense expenditures were expected to climb 8.3% this year, more the 4x the rate of increase last year:
While NATO countries like the U.K., France, and Germany have extensive aerospace & defense contractors, U.S. companies are generally regarded as having the latest and most sophisticated technology and, as such, are significant suppliers across the global alliance.
Meantime, in March, the Biden administration released a proposal to Congress for the fiscal year 2024 budget request of $842 billion for the Department of Defense. This would be an increase of $26 billion over FY 2023 (+3.2%) levels and $100 billion more than FY 2022 (+13.5%).
The end result of increased defense spending by NATO and the U.S. will be a significant tailwind for the U.S. Aerospace & Defense sector. So, let's take a look at how the XAR ETF has positioned investors to benefit from this trend.
Top-10 Holdings
The top-10 holdings in the XAR ETF are shown below and were taken directly from the SSGA XAR webpage where investors can find more detailed information on the fund.
State Street Global Advisors
The fund currently holds 32 companies in the portfolio. That being the case, the fund's equal-weight re-balance allocation (which takes place on the third Friday of the quarter ending month) would be 3.125% (assuming a zero cash balance). As can be seen in the graphic above, the top-10 holdings currently significantly exceed that "equal weight" allocation and are, therefore, the "winners" during the current quarter.
The #1 holding with a 4.4% weight is TransDigm Group ( TDG ). TransDigm designs and manufactures components for commercial and military aircraft. In May, TDG announced Q2 earnings of $5.98/share (a $0.51 beat) and boosted its FY23 commercial OEM revenue guidance to 20-25%. Q2 revenue was $1.59 billion (+19.5% yoy). The stock is +41.9% YTD and trades at a rather rich forward P/E=37x.
Howmet Aerospace ( HWM ) is the #3 holding with a 4.3% weight. Howmet specializes in making lightweight metal components for the aerospace market for use in jet engines, fastening systems, forged wheels, and structural elements. Q1 revenue was $1.6 billion (+21.2% yoy) and beat estimates by $110 million, led by a 29% increase in its Commercial Aerospace segment sales. In June, Morgan Stanley identified Howmet as a top-pick , saying:
It (Howmet ...) is a strong operator with upside from continued aerospace end market recovery and market share gains from VSMPO-AVISMA. Aerospace grade castings and forgings remain a bottleneck for new airplane production, providing Howmet with pricing power and market share wins from underperforming peers.
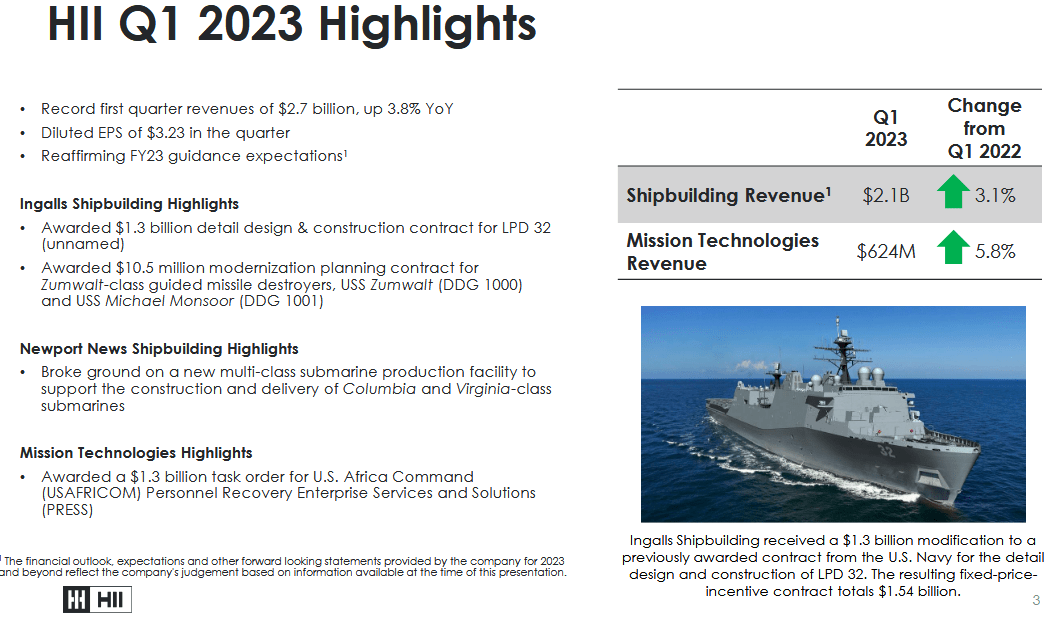
Huntington Ingalls Industries ( HII ) is the #7 holding with a 4.3% weight. The company builds nuclear and non-nuclear military ships in the United States. These include amphibious assault ships, expeditionary warfare ships, and national security cutters for the U.S. Navy and U.S. Coast Guard.
As shown in the slide above (taken from HII's Q1 presentation ), the quarter was solid and included a $1.3 billion contract for detailed design & construction of the LPD-32 ship as well as a $1.3 billion award for U.S. Africa Command for Personnel Recovery Enterprise Services and Solutions.
The #8 holding is L3Harris Technologies ( LHX ) with a 4.2% weight. According to Bloomberg Government , L3Harris is a top-10 defense contractor for United States, but at #9 ($6.4 billion) is much smaller as compared to companies like Lockheed Martin ( LMT ), RTX ( RTX ), General Dynamics ( GD ), and Boeing ( BA ):
Bloomberg Government
In June, L3Harris stock broke a long-lasting downtrend and is up 14.3% since June 1st:
The stock trades with a forward P/E of only 16.3x and yields 2.28%.
Performance
As mentioned earlier, the XAR ETF has a strong long-term performance track record and has delivered an average 10-year annual return of 13.5% and a lifetime average annual return of 15.79% since 2011:
State Street Global Advisors
The following chart compares the 3-year total returns of the XAR ETF with some of its peers: the iShares Aerospace & Defense ETF ( ITA ), the Fidelity Defense & Aerospace Fund ( FSDAX ), the Invesco Aerospace & Defense ETF ( PPA ), along with that of the broad market averages as represented by the Vanguard S&P 500 ETF ( VOO ) and the Invesco QQQ Trust ( QQQ ):
As can be seen from the graphic, the Aerospace & Defense sector has generally lagged the S&P 500 over the past 3-years. However, much of that under-performance was a result of Covid-19 and the severe and negative impact it had on commercial airline travel. That being the case, along with the NATO defense tailwind, this is arguably a good time for to have exposure to a "catch-up" in the commercial aircraft segment as well.
Risks
On-going downside risks include the potential that a weakening global and U.S. economy could cause a reduction in commercial airline travel.
Upside risks include the potential for increased M&A in the sector in which the equal-weight strategy of the XAR ETF would prove beneficial since it is over-weight the small and medium sized defense contractors in a sector well-known for consolidation. A continued and strong Covid-19 recovery in the global commercial airline segment could also provide additional upside potential.
From a valuation perspective, the XAR ETF currently trades at a slight discount to the S&P 500 in terms of the P/E ratio, and a significant discount from a price-to-book perspective:
Summary & Conclusion
The XAR ETF is an excellent fund for investors to gain exposure to the aerospace & defense sector. The equal-weight strategy should work well considering the A&D sector is known for consolidation as the big companies tend to buy the more innovative technology that small- and medium-sized companies develop. The XAR ETF has a very strong long-term performance track record and is well worth the 0.35% expense fee.
I'll end with a 10-year total returns chart of the XAR ETF as compared to the broad market averages as represented by the VOO and QQQ ETFs and note that - despite the impact of Covid-19 - the XAR ETF has actually outperformed the S&P 500 over the past decade:
For further details see:
XAR: An Excellent Defense ETF To Benefit From A Rejuvenated NATO