RTX - Your New Year's Resolution For 2024: Invest $10000 In These 5 Stocks
2023-12-29 14:54:46 ET
Summary
- I review the stocks of five world-class companies that I am convinced will bring me closer to my ambitious goal of being able to fund my living expenses through dividends.
- I point out the specifics of the companies' business models, discuss their profitability and balance sheet quality, and evaluate their dividend growth record and future prospects.
- Dividend growth investing is not a get-rich-quick strategy, it requires commitment and a long-term mindset. I think it's worth making a New Year's resolution to help maintain that mindset.
- I lay out a hypothetical example of an investor starting their investment journey in 2024 and explain what a significant impact commitment and regular portfolio contributions can have.
Introduction
With 2023 drawing to a close, I'm spending time doing some soul-searching - also with regard to my investments.
I'm investing with the long-term goal of being able to pay my living expenses with dividend checks only, without having to touch the principal. In my view, the classic 4% rule (or similar approaches) is flawed - especially from a psychological perspective, as I explained in some of my previous articles (e.g. from March and April 2022 ).
Of course, it is an ambitious goal to fund your living expenses only through dividends, mainly because it requires a lot of commitment, conviction, planning and a very large portfolio. Since the S&P 500 (e.g., SPDR S&P 500 ETF Trust, SPY ) currently yields only 1.4%, generating an annual gross income of, say, $50,000 would require a portfolio size of $3.6 million. It is therefore obvious that the dividend yield of my portfolio must be significantly higher. At the same time, it is crucial to avoid yield traps and instead focus on companies that offer plenty of scope for dividend growth.
In this article, I would like to discuss five stocks that I will focus on in 2024 and that I am convinced will bring me closer to my ambitious goal. In addition to a brief overview of their business models, profitability and balance sheet quality, I will also look at their qualities through the lens of a dividend growth investor. Admittedly, some of these high-quality companies are not necessarily on sale today. However, in the final section of the article, I will explain why the focus on value should not be overstated - there are far more important aspects to consider.
CME Group Inc. - Stability In Times Of Stress
CME Group Inc. ( CME ) is a financial services company that is often shunned because of its apparent complexity and the role it plays in financial risk management. In my opinion, however, CME is quite simple to understand. It primarily provides market participants with access to financial derivatives such as futures, options and over-the-counter products, enabling timely and effective risk management. CME's services are always in demand, but especially in times of economic uncertainty and/or increased market volatility. I therefore value CME stock as a "counterweight" in my portfolio. I first covered CME Group here on Seeking Alpha in March of 2022 and published a follow-up in September after the Q2 results .
CME Group is one of the world's leading - if not the leading - exchange operators. In addition to its namesake exchange, the Chicago Mercantile Exchange, it owns the Chicago Board of Trade (CBOT), the New York Mercantile Exchange and the Commodities Exchange (NYMEX and COMEX, respectively). It offers the widest range of benchmark products in the categories of equity indices, interest rates, foreign exchange, energy, agricultural commodities, and metals. CME benefits from significant economies of scale, network and lock-in effects. The barriers to entry for new competitors are very high.
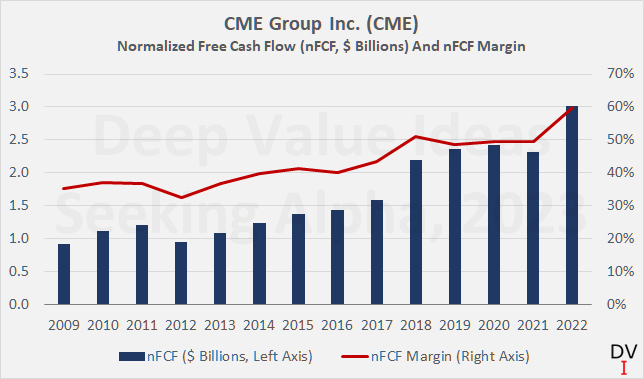
Over the years and decades, CME Group has recorded steady sales growth - both organically and inorganically. It is an extremely profitable company, which in my view is best illustrated by the gradual increase in the free cash flow margin (Figure 1).
Figure 1: CME Group Inc. (CME): Free cash flow and free cash flow margin, adjusted for stock-based compensation and working capital movements (own work, based on company filings)
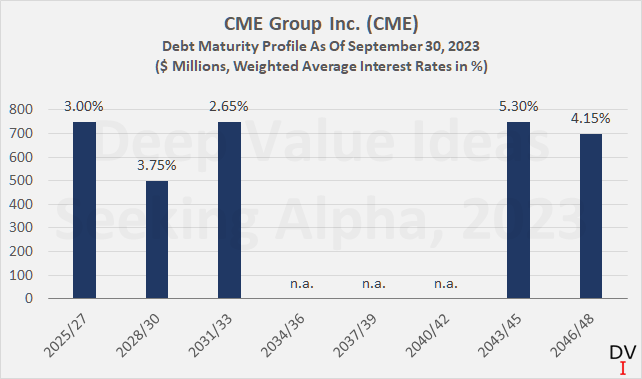
Considering that CME generates more than $2.6 billion in free cash flow annually (three-year average, adjusted for stock-based compensation), it is also easy to see that it is in very healthy financial shape. At the end of the third quarter of 2023 , CME had only $3.4 billion in debt on its balance sheet, partly offset by $2.4 billion in cash, cash equivalents and marketable securities. This puts CME's leverage ratio at only around 0.4 times free cash flow. Interest coverage is very healthy at more than 20 times free cash flow, and this figure does not even include interest income. If we assume that CME receives 3.5% on its cash and cash equivalents, its net interest expense would be 65% lower than its gross interest expense of currently $130 million. With a current weighted average interest rate of 3.77% and a balanced maturity profile (Figure 2), the company is well insulated against a "higher for longer" interest rate environment. No wonder rating agency Moody's recently affirmed CME Group's long-term credit rating of Aa3 with stable outlook (S&P equivalent of AA-).
Figure 2: CME Group Inc. (CME): Debt maturity profile, as of September 30, 2023 (own work, based on company filings)
The combination of a very profitable business model, a healthy balance sheet and very limited risk in the event of a counterparty default (see section on risks in my first article) provides the basis for a very solid dividend growth investment. CME Group has increased its quarterly dividend for 13 years in a row (5- and 10-year average growth rates of 9%, Figure 3) and typically declares a special dividend at the end of the year. For example, the company recently declared a special dividend of $5.25 (record date December 28), bringing the theoretical yield on the stock to 4.6%. In my view, CME's dividend policy is well aligned with earnings and cash flow volatility, and the company can be expected to maintain its regular dividend (current payout ratio 60% of FCF) even in times of weakness.
Figure 3: CME Group Inc. (CME): Regular and special dividends declared since 2011 (own work, based on company filings)
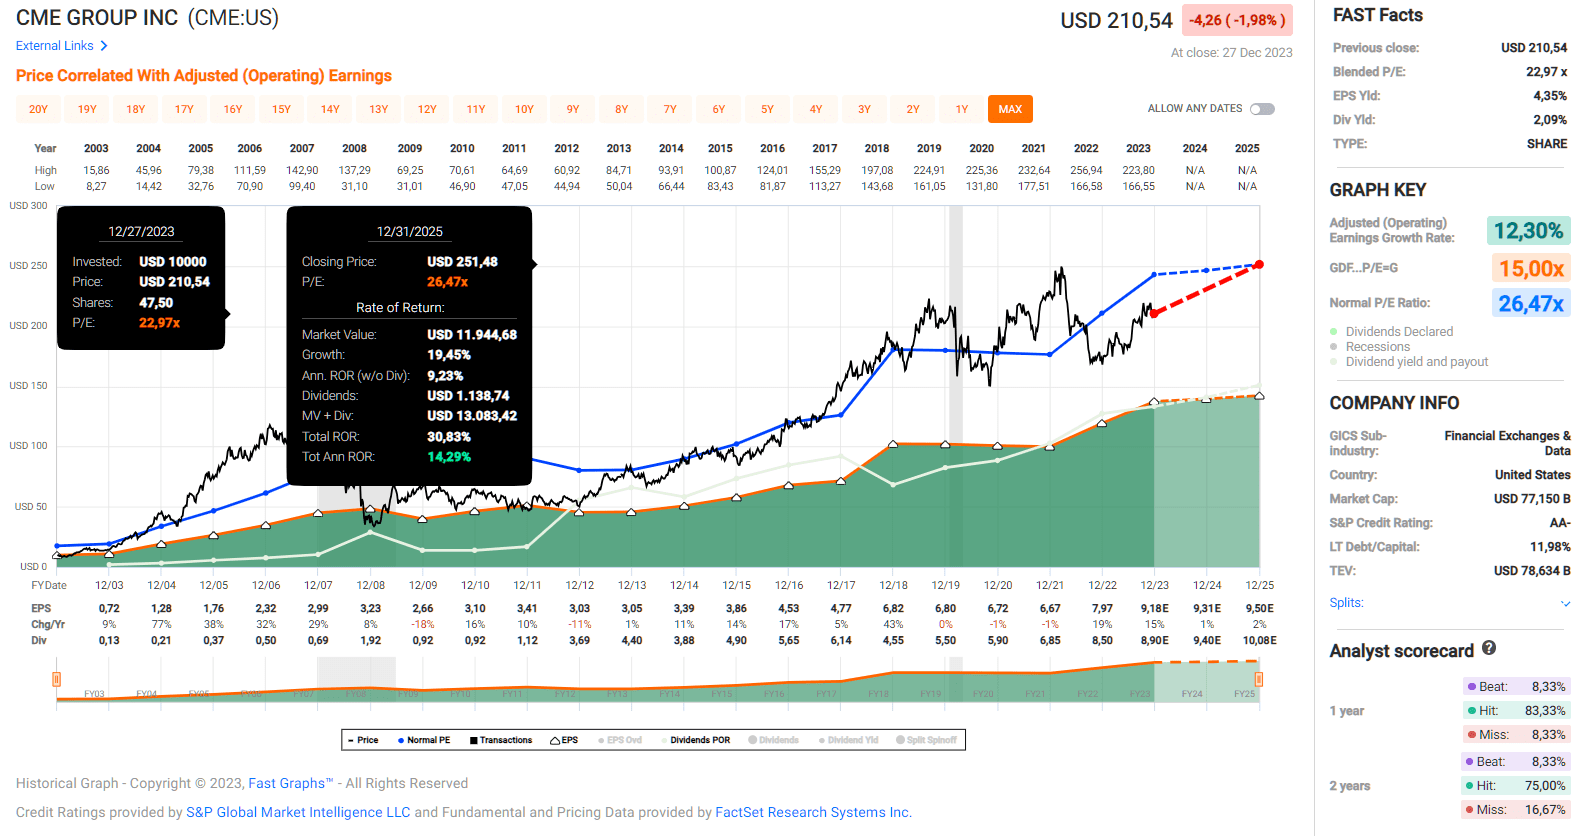
It is not difficult to understand that such companies do not trade cheaply. With a blended price-to-earnings (P/E) ratio of 23 (Figure 4), CME stock is currently trading only slightly below its long-term average valuation of 26 times adjusted earnings. That said, the near-term return prospects aren't that bad, but of course I would take analysts' estimates with a grain of salt, given the nature of CME's business. The stock isn't cheap from a free cash flow perspective either, but given its high quality, reliable earnings and cash flows, excellent profitability and rock solid balance sheet, I don't mind paying almost 30 times free cash flow (3.4% yield), but of course I'm not as enthusiastic as I was when the stock traded at around $180 earlier this year.
Figure 4: FAST Graphs chart for CME Group Inc. (CME), based on adjusted operating earnings per share (FAST Graphs)
RTX Corporation - Currently Grounded, But Soon Off To New Highs
RTX Corp. ( RTX , formerly known as Raytheon Technologies Corp.) shareholders have not had an easy 2023 due to uncertainties and share price weakness stemming from quality issues with the company's flagship aircraft engine franchise (geared turbofan, GTF). I shared my views on this topic in a detailed analysis in August 2023 and provided an update in late October after management provided new insights following the accelerated inspection of a large number of Pratt & Whitney (P&W) PW1XXXG engines.
The GTF engine is a technologically advanced aircraft engine and it is only natural that quality issues will arise. More important than these problems themselves, in my opinion, is how the management deals with them. Under no circumstances should the company's reputation be put at risk. I therefore believe that proactively dealing with the problem was the right approach. RTX Corp. management has communicated transparently and ensured that P&W's reputation as a world-class aircraft engine manufacturer does not suffer, and the costs associated with the issue are well established by now.
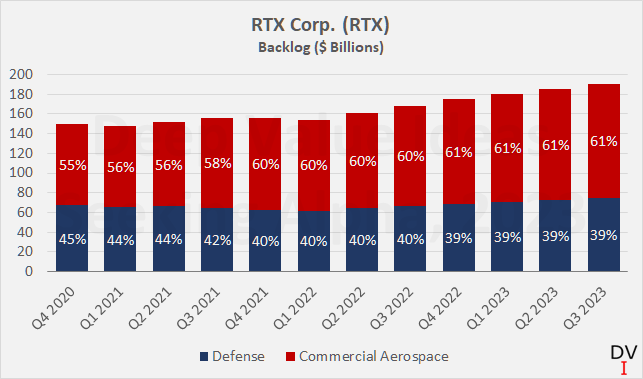
In my view, RTX Corp. remains a well-respected and highly diversified provider of commercial aerospace and defense technologies. The company's backlog is very strong, and I highly value the significant contribution of defense contracts (Figure 5). As I explained in my first article on the company (a comparative analysis with Lockheed Martin Corp. - LMT ), RTX Corp. is in a sweet spot that allows its investors to benefit from economic expansion while limiting downside thanks to its defense division. To put the current backlog of $190 billion into perspective - that's nearly three times the company's net sales in 2022. In addition to the company's well-diversified and very strong backlog, it's also worth noting that RTX's services revenue is doing its part to dampen earnings volatility (currently nearly 25% of net sales). Recurring revenues (maintenance, repair, overhaul, and upgrades) are expected to gradually increase as the installed base of the GTF engine and other platforms such as the P&W F135 engine (installed on the Lockheed Martin F-35 Lightning II) continues to grow.
Figure 5: RTX Corp. (RTX): Segment backlog at quarter end (own work, based on company filings)
However, RTX is one of the companies that currently has a somewhat high level of debt in relation to its free cash flow. At the end of the third quarter, net debt amounted to $29.8 billion, almost seven times the current free cash flow. However, RTX's free cash flow is currently impacted by the P&W engine issue (largely compensation of airlines and repair costs) and should increase sharply as the GTF engine installed base grows (Airbus A320). I shared my updated expectations for RTX's free cash flow - along with a discounted cash flow valuation - in my late October article published here on Seeking Alpha.
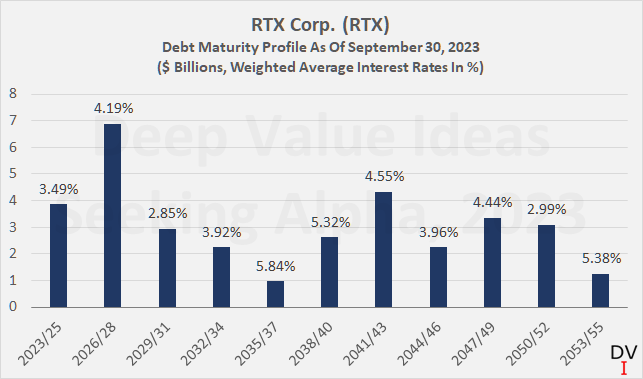
The recent announcement of a $10 billion accelerated share buyback program was widely seen as a strong sign of management confidence in the business. I tend to agree with the market here, although I would have preferred a slightly more modest approach given the comparatively high debt levels - after all, RTX's management has likely bought back nearly $13 billion worth of shares this year. So I'm not surprised that rating agency Moody's changed the outlook on RTX's Baa1 long-term credit rating to negative after the announcement. In this context, it is also worth noting RTX's rather high short-term maturities (Figure 6). The company's current weighted average interest rate is around 4.1%. Given the additional debt taken on to finance the buybacks and the necessary refinancing transactions, one can therefore assume that the debt servicing capacity will weaken (currently around four times free cash flow before interest). Of course, as a conservative investor, I am not happy about these developments, but in view of the expected significant improvement in free cash flow in the future, I don't think this temporary weakness should be overinterpreted.
Figure 6: RTX Corp. (RTX): Debt maturity profile, as of September 30, 2023 (own work, based on company filings)
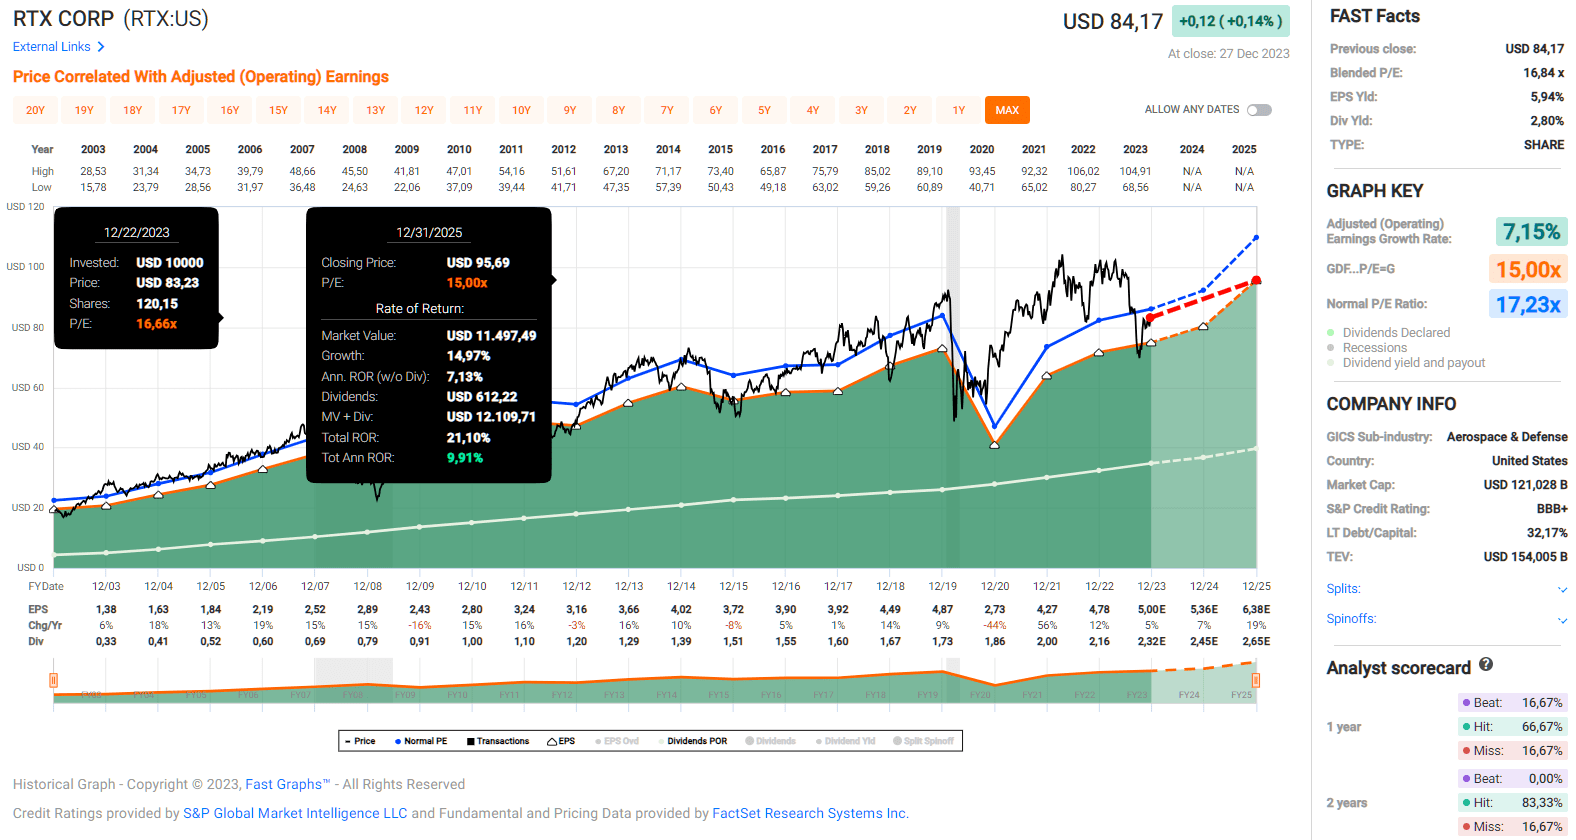
Despite these temporary challenges, I believe RTX is a good dividend stock and a well-run company overall. Management continues to focus on returning cash to shareholders, not only through buybacks, but also through a growing dividend ( last increase 7.3% ). The stock is difficult to value from a current earnings and free cash flow perspective (P/E of 17, Figure 7, FCF yield of 3.3%), but considering management's projections for 2025 and my longer-term expectations, I still think it can be concluded that the stock is a good value today. Of course, I'm far less enthusiastic than I was earlier this year - partly because RTX's dividend yield is now well below 3%.
Figure 7: FAST Graphs chart for RTX Corp. (RTX), based on adjusted operating earnings per share (FAST Graphs)
Roche Holding AG - A Top Healthcare Pick For 2024 And Beyond
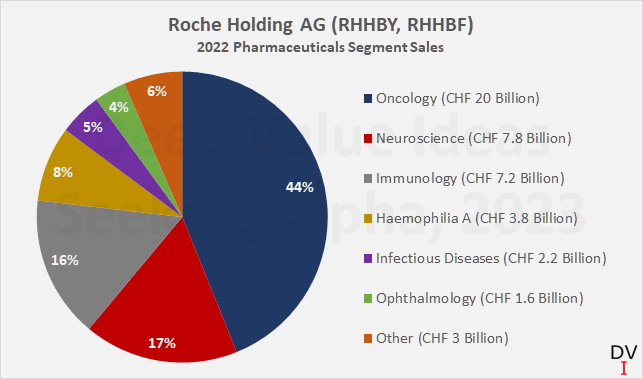
The Swiss healthcare giant Roche Holding AG ( OTCQX:RHHBY , OTCQX:RHHBF ) is a fortress in its own right. Through Genentech, which was acquired and became a subsidiary of Roche in 2009 , the company maintains a highly innovative range of antibody-based therapies. The focus on biologics (~80% of sales in the Pharmaceuticals segment) - while going in hand with heavy R&D spending - puts the company in a comparatively better position than competitors focusing on small molecule drugs, which are typically subject to faster sales erosion, and may also fall under the Inflation Reduction Act . Roche is focused on oncology therapeutics (44% of 2022 Pharmaceuticals segment sales), but I think it is fair to say that the company's portfolio is well diversified across several key therapeutic areas (Figure 8). In oncology, the company's focus on personalized therapies (e.g., collaborations with Adaptive Biotechnologies ( ADPT ), BioNTech ( BNTX ) and Vaccibody ) is noteworthy, and I think Roche's Diagnostics segment also benefits from this focus.
Figure 8: Roche Holding AG (RHHBY, RHHBF): 2022 Pharmaceuticals segment sales (own work, based on company filings)
As the pandemic has shown us, Roche is also a leader - if not the market leader - in diagnostics. With a sales contribution of 27%, the Diagnostics segment is a welcome and significant diversification from the inherently riskier Pharmaceuticals segment. I would not overestimate the current weakness due to lower demand for SARS-CoV-2 diagnostics material. Frankly, I embrace it because I believe it (along with pipeline uncertainty) is the main reason for the stock's current and underperformance and therefore its comparatively cheap valuation (see comments on valuation below).
Roche is solidly profitable, with an average return on invested capital ((ROIC)) well above 20% and a free cash flow margin typically above 20% (as above, after taking into account stock-based compensation). Although free cash flow in 2022 was somewhat disappointing - mainly due to the significant increase in working capital and slightly higher interest expense - I believe Roche's long-term cash profitability remains unquestionable.
The company is family-controlled (Roche bearer shares, ticker OTCQX:RHHBF ), and the conservative stance of the Hoffmann and Duschmalé families is also reflected in the robust balance sheet. At the end of the second quarter of 2023, Roche's net debt amounted to CHF 17.9 billion (p. 44, half-year report 2023 ), which corresponds to a leverage ratio of only 1.4 times the three-year average free cash flow - and bear in mind that the leverage ratio is currently still "elevated" due to the buyback and subsequent cancellation of 55.3 million Roche bearer shares from Novartis AG ( NVS , OTCPK:NVSEF ) in December 2021 (p. 9, 2022 annual report ). Roche's long-term credit rating is currently Aa2 (S&P equivalent of AA), having been raised by one notch in September 2022.
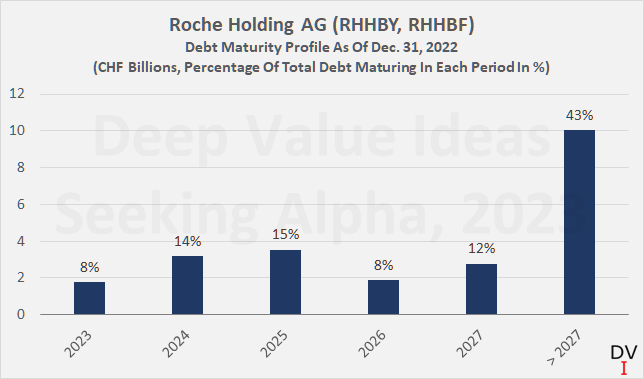
While Figure 9 shows that debt maturities in the near future are relatively high (more than 50% of debt matures within five years), it should be borne in mind that Roche could actually repay the debt "on the go". Roche typically pays out only around 60% of free cash flow, so could theoretically retire around CHF 5 billion in debt each year without cutting the dividend. Similarly, the company could currently buy back around 2.6% of its outstanding shares from free cash flow after the dividend. However, share buybacks are not usually on management's agenda, with the notable exception of the Novartis transaction at the end of 2021.
Figure 9: Roche Holding AG (RHHBY, RHHBF): Debt maturity profile, as of December 31, 2022 (own work, based on company filings)
Due to its low level of debt, Roche naturally has plenty of flexibility for acquisitions. Recently, Roche made headlines with the acquisition of obesity and diabetes therapeutics company Carmot Therapeutics Inc. The company currently has three candidates in Phase 1 or 2 (injectable and oral) with similar modes of action to semaglutide (Ozempic/Wegovy, Novo Nordisk A/S, NVO ) and tirzepatide (Mounjaro/Zepbound, Eli Lilly & Co., LLY ).
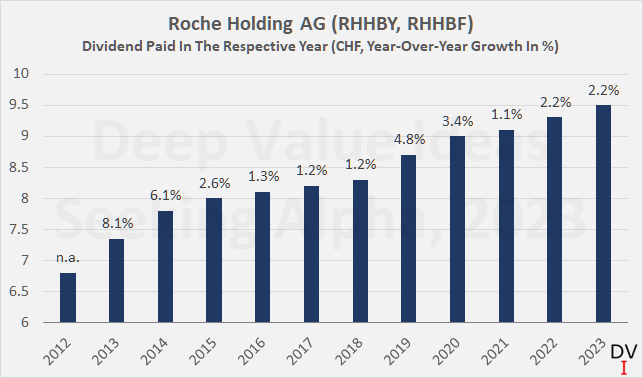
As I explained in another article , I do not consider Roche to be as good a dividend growth stock as Johnson & Johnson ( JNJ ), mainly due to the (currently) rather low dividend increases. Investors looking to at least maintain their purchasing power have been disappointed by Roche's management (Figure 10). However, given its excellent long-term track record (20-year CAGR of 9.9%), undeniably good prospects, solid profitability and rock-solid balance sheet, I see no reason why dividend growth should not accelerate in the future as pipeline uncertainties dissipate.
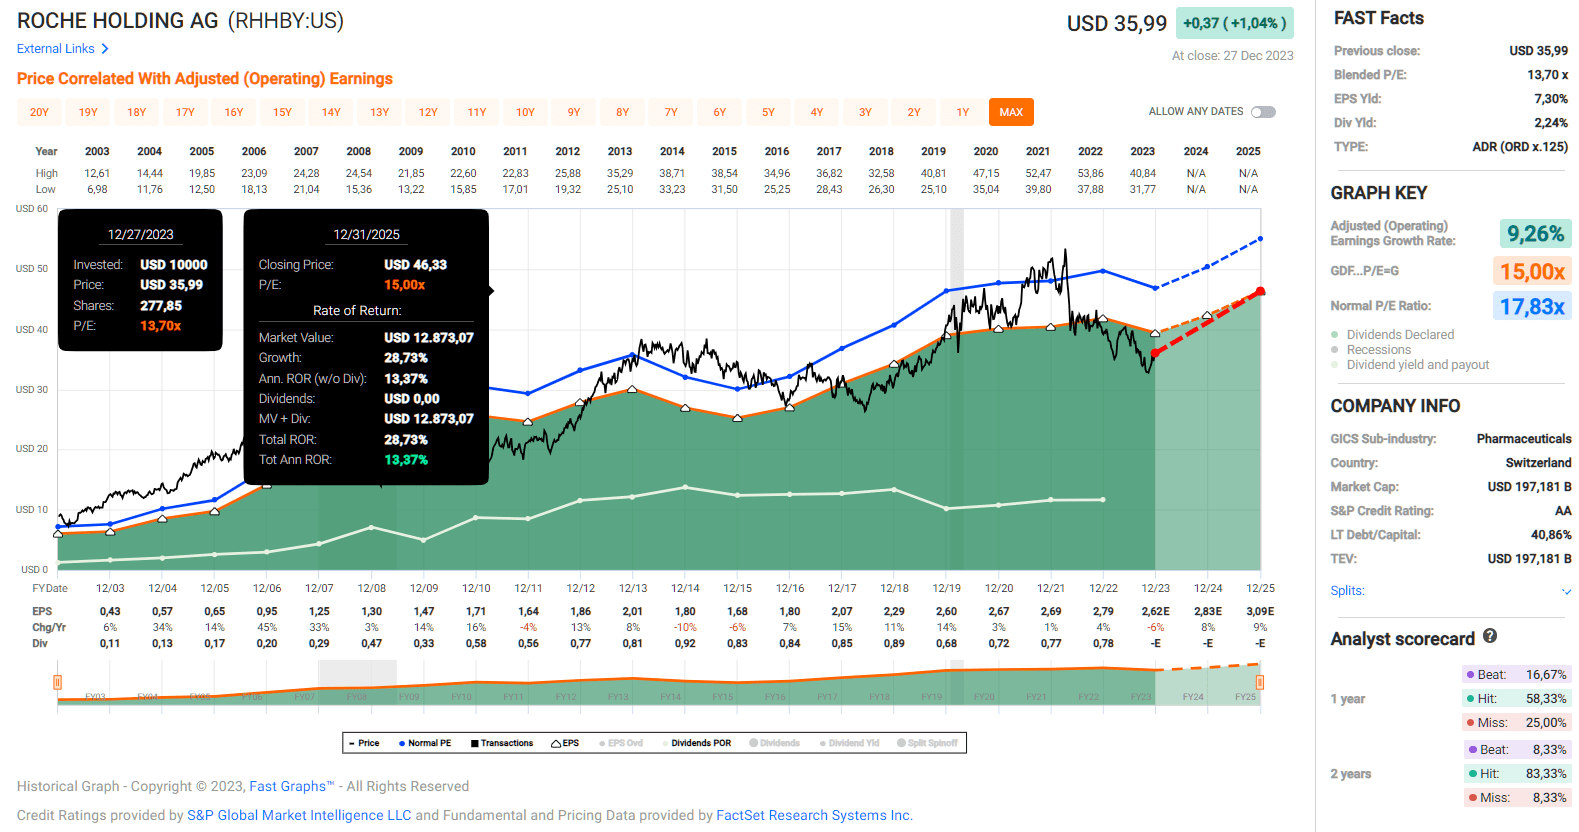
Another reason for my preference for JNJ stock from a dividend investment perspective was the comparatively low starting yield of Roche shares at the time I wrote the article. However, mainly due to the - expected - weaker sales of SARS-CoV-2 diagnostic material and pipeline uncertainties, Roche has declined quite a bit in value - especially when measured in its home currency, the Swiss franc. The ADRs (ticker OTCQX:RHHBY ) currently have a yield of almost 4%, which is very high by historical standards . Such a starting yield makes it much easier to look beyond the (temporarily) weaker dividend growth. Roche ADRs are currently trading at a free cash flow yield of 6.5% and a blended price-to-earnings ratio of less than 14, well below the long-term average earnings multiple of 17.8 (Figure 11). I consider this to be a very compelling valuation and am therefore currently in the process of building a (significant) position in Roche shares. However, as I explained in another article , I prefer exposure via voting shares and I buy my shares on the SIX Swiss Stock Exchange.
Figure 10: Roche Holding AG (RHHBY, RHHBF): Dividends paid since 2012 (own work, based on company filings) Figure 11: FAST Graphs chart for Roche Holding AG ADRs (RHHBY), based on adjusted operating earnings per share (FAST Graphs)
The Coca-Cola Company - Why I Focus On It Rather Than PepsiCo In 2024
The Coca-Cola Company ( KO ) and PepsiCo, Inc. ( PEP ) are both - rightly - referred to as "sleep well at night" stocks. The products they sell are known and appreciated all over the world and are consumed by many people on a daily basis. It is no exaggeration that PEP and KO are companies with recession-resistant business models. Low-dollar products such as branded soft drinks, snacks or coffee are among the last things that consumers on a tight budget forgo in times of economic hardship.
Both Pepsi and Coca-Cola are world-class brands, but it would be short-sighted to buy KO stock or PEP stock just for the respective namesake brand. The Coca-Cola Company owns a wide range of other beverage brands such as Fanta, Fresca, Fuzetea, Powerade, Minute Maid, Sprite, Topo Chico, but is also involved in the coffee business through Costa Coffee - a particularly popular brand in the United Kingdom. In contrast, PepsiCo operates a diversified food/snack business alongside its beverage business with brands such as Fritos, Quaker, Lay's, Cheetos, Munchies and many others.
However, having scrutinized PepsiCo time and again, I have mixed feelings about PEP's investment case as a dividend stock ( see this article ). The company's leverage knows only one direction - up and to the right. To a certain extent, this is understandable. Pepsi's own room for growth is limited, and the company - like most other consumer staples companies - is more or less forced to grow through acquisitions. In addition, the company needs to acquire companies of a certain size to make an impact - acquiring a start-up snack company does not move the needle, and it takes many years to develop a brand into a significant revenue contributor. Mature companies do not usually come cheap.
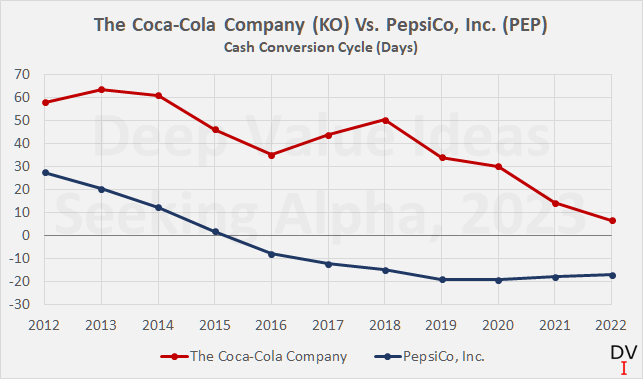
What concerns me more, however, is the fact that free cash flow growth has been lackluster at best - despite more or less regular acquisitions and a relentless focus on streamlining working capital management. PepsiCo's cash conversion cycle has been declining for years, bottoming out at around -20 days in 2019/20 (Figure 12) - an indication that the company is managing its inventories, payables and receivables very efficiently. As an aside, those interested in an in-depth discussion of working capital management should take a look at my comparative analysis of The Coca-Cola Company and PepsiCo, Inc.
Figure 12: The Coca-Cola Company (KO) and PepsiCo, Inc. (PEP): Cash conversion cycle (own work, based on company filings)
It is very interesting to see that despite a higher cash conversion cycle, KO's free cash flow is in much better shape than PEP's (Figure 13) - despite significantly weaker sales growth. Coca-Cola has adapted its business model (consolidation of bottling and distribution operations, increasing reliance on independent bottlers), which led to a dramatic decrease in capital intensity. The company's free cash flow margin improved from around 15% ten years ago to the mid-20% range, while PepsiCo's margin remains in the high single digits.
Figure 13: The Coca-Cola Company (KO) and PepsiCo, Inc. (PEP): Free cash flow, adjusted for stock-based compensation and working capital movements (own work, based on company filings)
From a balance sheet perspective, Coca-Cola does not look much worse today than it did ten years ago. Of course, net debt has increased, albeit at a rather slow pace of 2.8% per year on average. By contrast, PepsiCo's debt has grown twice as fast and is now 74% higher than at the end of the third quarter of 2014. KO's leverage is currently rather modest at 2.5 times the three-year average free cash flow (PEP: 5.4 times). Nevertheless, I think it would be an exaggeration to conclude that PepsiCo's debt servicing ability is poor, let alone that the company could run into financial difficulties in the future. This is also underscored by the fact that both KO and PEP are rated A1 with a stable outlook by Moody's (S&P equivalent of A+). PepsiCo's rating was last affirmed in May 2020 , while Coca-Cola's rating was last affirmed in June 2023 .
From a dividend perspective, PEP's management is undoubtedly very shareholder-friendly, but I still think the current pace of dividend increases is a bit excessive - not to say aggressive. A 10% increase, such as the one announced in May 2023 , is of course nice to see, but PEP's payout ratio in relation to current (as well as three-year average) free cash flow is over 100%. When considering that the company is also buying back its own shares, it is borrowing to fund shareholder returns. I'm not suggesting that PepsiCo is headed for financial trouble, but I think it's only reasonable to expect moderation in dividend growth and share buybacks going forward.
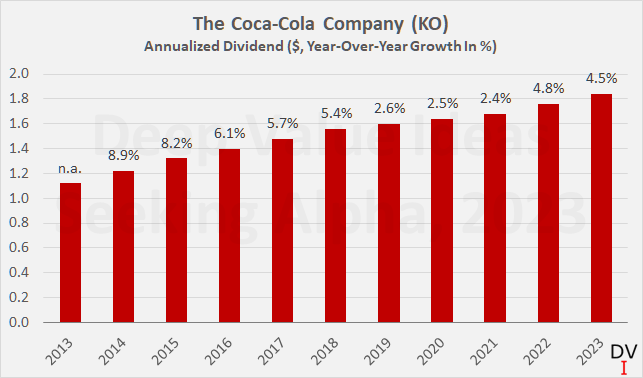
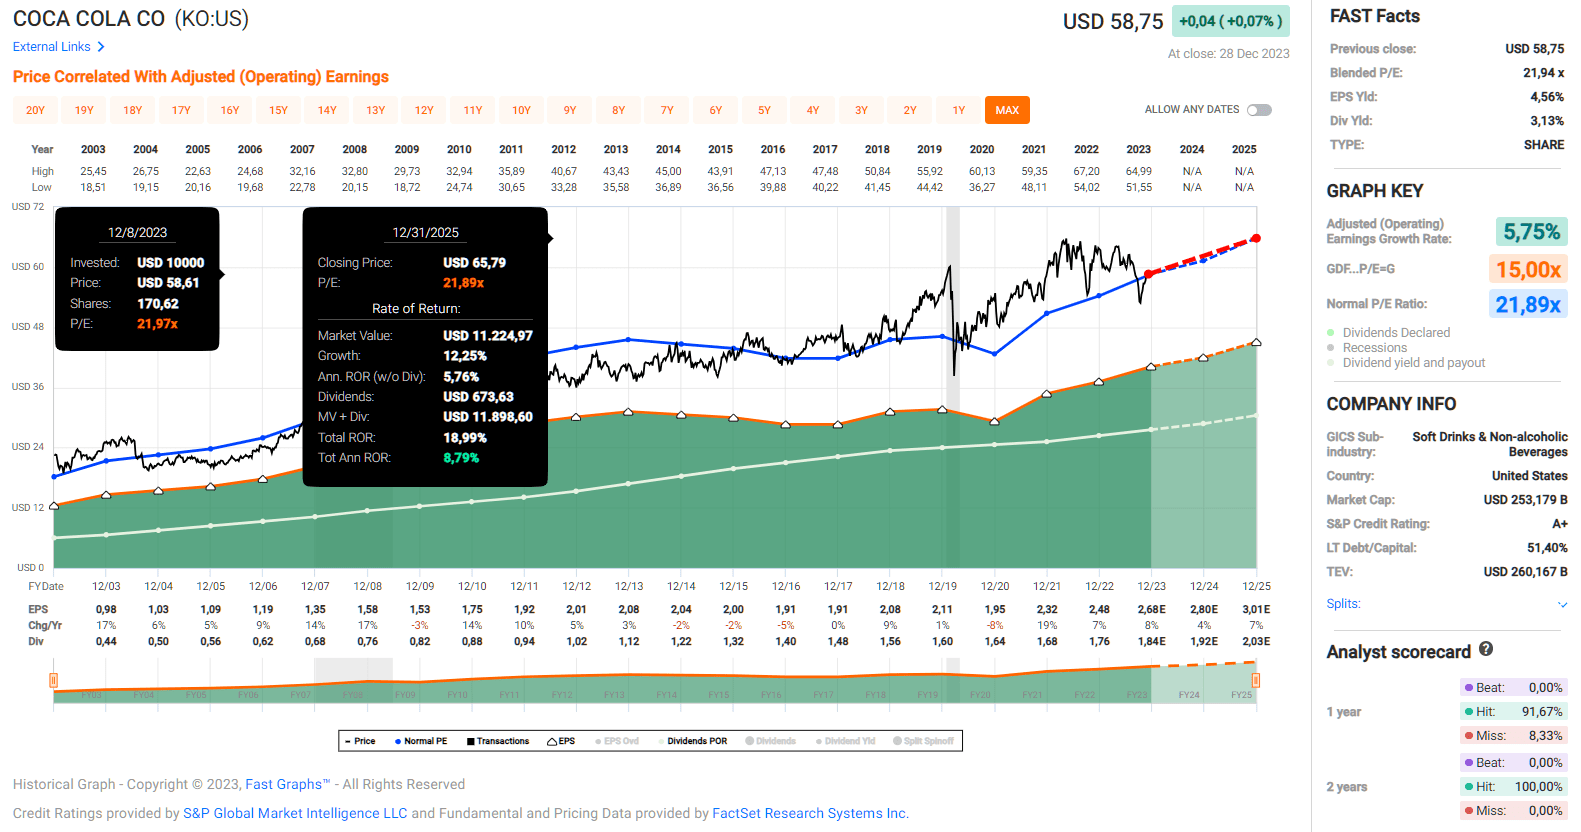
Coca-Cola, on the other hand, is more conservative with an average payout ratio of 80% of free cash flow, but dividend increases were still meaningful. The average 10-year and 3-year dividend growth rates were 5.1% and 3.9% respectively (Figure 14), which is broadly in line with free cash flow growth.
Figure 14: The Coca-Cola Company (KO): Annualized dividends since 2013 (own work, based on company filings)
From a valuation perspective, both stocks are expensive, but that's no surprise given that they are on everyone's radar and generally perceived as safe long-term dividend payers. Both currently trade at a blended price-to-earnings ratio of 22 (Figure 15 - Coca-Cola), but from a free cash flow perspective, Coca-Cola shares are quite a bit cheaper with a current yield of 3.8% versus 2.7% for PepsiCo shares.
Figure 15: FAST Graphs chart for The Coca-Cola Company (KO), based on adjusted operating earnings per share (FAST Graphs)
For these reasons, and because my position in KO is still a fair bit smaller than my position in PEP, I will focus on KO rather than PEP in 2024. I certainly won't run out and buy in the first week of January, but expect to add on weakness, ideally at a P/E ratio of 20 or less and a starting dividend yield of 3.4% or more.
The Procter & Gamble Company - A True Widow And Orphan Stock
Procter & Gamble ( PG ) is a very high-quality company with many excellent brands , and I also consider it to be a largely recession-resistant business. However, for the reasons mentioned above, I consider P&G to be somewhat less recession-resistant than beverage and snack companies such as Coca-Cola and PepsiCo. But that doesn't change the fact that P&G is an excellent and increasingly well-managed company - especially since activist investor Nelson Peltz got involved in 2017 (his service on the Board of Directors ended in 2021 ).
The company's cash return on invested capital (CROIC) is now regularly on par with ROIC. In contrast to ROIC, CROIC is not based on the operating result (which is relatively easy to manage), but provides an indication of the company's actual cash profitability. Both figures are significantly higher than the respective cost of capital measure (weighted average cost of capital and cost of equity), which confirms that the company is creating solid shareholder value.
P&G's free cash flow margin is in the high teens and even exceeded 20% in fiscal 2021. Since then, cash profitability has declined somewhat, but knowing how P&G has benefited from the pandemic and had to cope with inflationary pressures in subsequent years, the volatility in profitability is only understandable. The modest decline in profitability in fiscal 2023 is also due to comparatively higher investments in the business and higher interest expenses.
The higher debt service expenses are largely due to the currently comparatively high proportion of short-term debt: $6.2 billion in commercial paper and $4.0 billion in long-term debt maturing within one year. While P&G has benefited from the low or even zero interest rate environment, the recent interest rate hike cycle by the Federal Reserve and also the European Central Bank has led to a significant increase in the weighted average interest rate on P&G's short-term debt (currently 4.2% compared to 0.8% at the end of fiscal 2022).
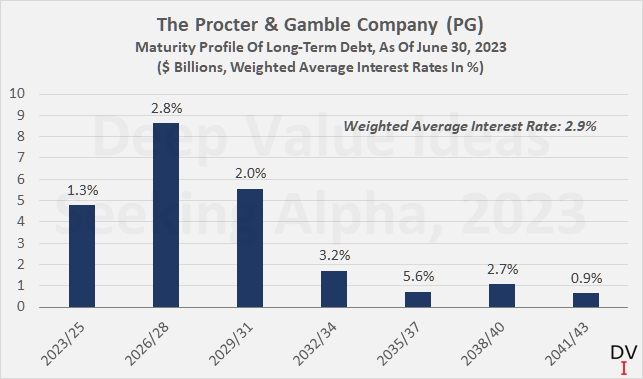
However, considering that P&G's leverage remains very conservative at less than two times free cash flow, I wouldn't over-interpret the higher debt servicing expenses. It's also worth noting that P&G typically has $8-$9 billion in cash and cash equivalents, which partially offsets the higher short-term interest expense. For example, the company had interest expense of $756 million and interest income of $307 million in fiscal 2023. Nonetheless, and given that the weighted average interest rate on P&G's long-term debt is still only 2.9%, it is worth taking a look at the company's maturity profile:
Figure 16: The Procter & Gamble Company (PG): Maturity profile of long-term debt (own work, based on company filings)
Due to the relatively high near-term maturities and the low interest rate of these bonds, a further decline in debt servicing capacity can be expected, provided that interest rates remain at current levels for several years. However, what sounds worrying should not be over-interpreted. P&G has a solid long-term credit rating ( Aa3, last affirmed in October 2022 ), and its interest coverage ratio was still above 30 times the current free cash flow before interest in fiscal 2023. If - which I think is highly unlikely - interest rates remain at current levels through 2028 and zero free cash flow growth is assumed, P&G's interest coverage ratio would still be close to 20x.
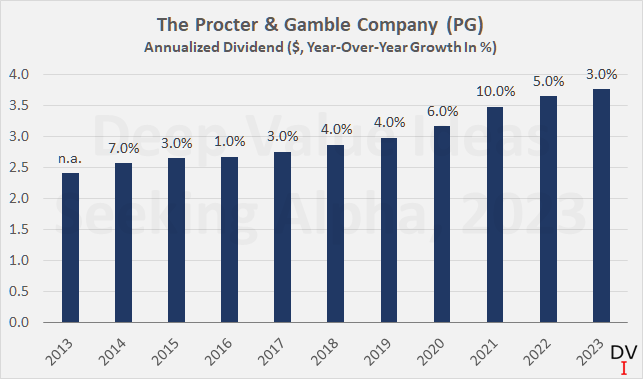
It is well known that P&G is a dividend king, having increased its dividend uninterruptedly for 67 years . Dividend growth has slowed somewhat in recent years (Figure 17), but I would argue that this is a reflection of management's conservative approach rather than a sign of exhaustion. The company's dividend payout ratio is only about 60% of free cash flow (three-year average). Therefore, and given its conservative balance sheet and very high-quality brand portfolio, I see no reason why P&G should not return to more significant dividend growth rates in the future.
Figure 17: The Procter & Gamble Company (PG): Annualized dividends since 2013 (own work, based on company filings)
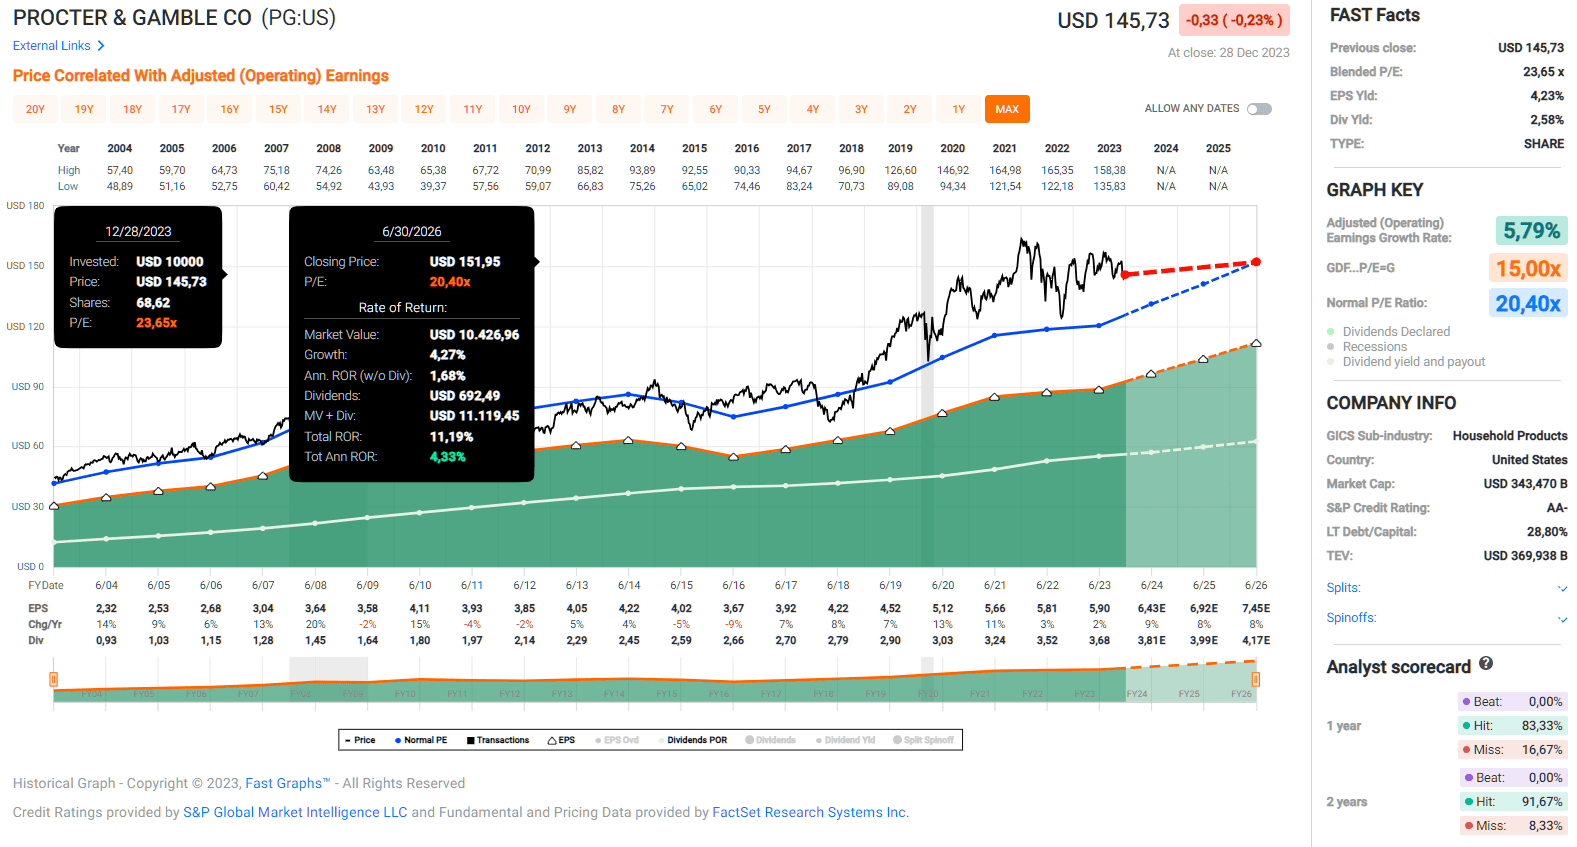
My long-term followers who remember my New Year's resolution for 2023 know that I already had Procter & Gamble stock on my list for 2023. Given its strong fundamentals and conservative balance sheet, it's no wonder the stock is rarely cheap (blended P/E 24 - Figure 18, FCF yield 3.7%, dividend yield 2.6%). As a long-time investor, I find myself in a situation where I see my P&G position gradually shrinking in relative terms, while I continue to add to opportunities that are more compelling from a valuation perspective. I therefore force myself to add at least a modest amount to my position each year, even when no obvious opportunity presents itself. However, I keep an eye on the expensive valuation and would only add significantly to my position if a favorable opportunity presents itself. Due to the unbroken demand for growth stocks in 2023 and the continuing euphoria, especially in technology stocks, I would not rule out the possibility that 2024 will be similar to 2021 - a year that has turned out to be a good year for adding value stocks.
Figure 18: FAST Graphs chart for The Procter & Gamble Company (PG), based on adjusted operating earnings per share (FAST Graphs)
Conclusion - And The Difference Long-Term Commitment Can Make
Without a doubt, the companies I have discussed in this article are all of high quality. Quality rarely comes at a cheap price, but as an investor with time on my hands, that's not a problem. I've learned that it's much better to focus on solid companies at a fair price rather than looking for the next super bargain. It's equally important to stay disciplined, maintain a high savings rate and practice dollar cost averaging.
To illustrate this, let's see how a hypothetical investor who spends $2,000 on each of the five stocks discussed in this article in 2024 would fare after 30 years.
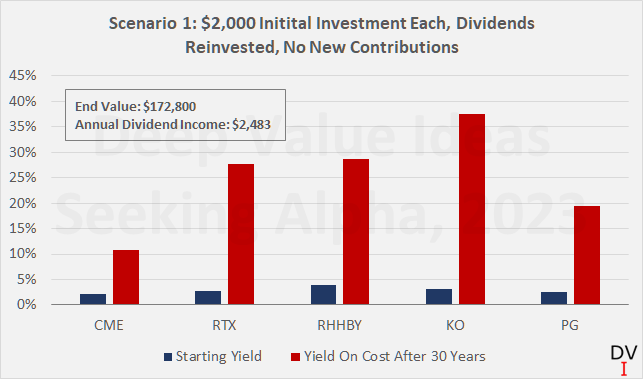
In the first scenario, I have assumed that apart from the initial investment of $10,000, no new contributions from external financial sources over the next 30 years. All companies continue to grow their dividends at their respective 10-year CAGR. The dividends are reinvested at a share price that has grown based on the respective 10-year CAGR (or at least 2%) and the shares are held in a tax-deferred account.
Figure 19 shows that, despite the current high valuation of some of the stocks discussed in this article, the value of the portfolio would have increased from $10,000 to more than $170,000 - a compound annual growth rate of 10%, just by letting the power of compounding work its magic. The dividend income would have risen from $280 today to almost $2,500 after 30 years. And this thought experiment does not even include the rather regular special dividend from CME Group.
As an aside, the more pronounced increase in the yield on cost for Roche, RTX Corp. and Coca-Cola shares is due to the fact that they have only experienced a relatively small increase in value over the last ten years. This shows the importance of reinvesting dividends, in particular in times of poor stock performance. In this context, I wholeheartedly recommend reading Jeremy Siegel's book " The Future for Investors: Why the Tried and the True Triumph Over the Bold and the New " to anyone who has not yet done so.
Figure 19: Hypothetical yields on cost for CME, RTX, RHHBY, KO, and PG stock after 30 years of dividend reinvestments and zero additions of new capital (own work)
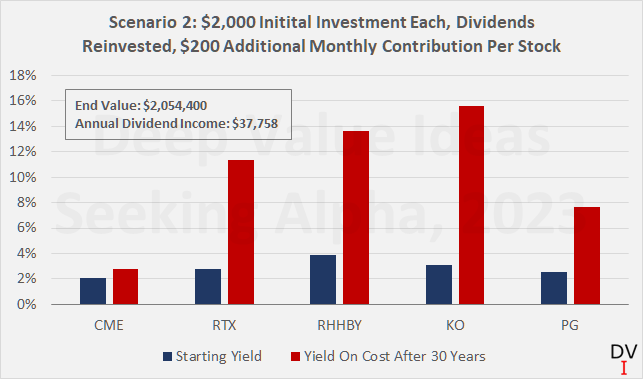
But what if our hypothetical investor decided to invest $200 in each of the five stocks every month? Over the course of 30 years, the value of the portfolio would grow to more than $2 million and generate an annual income of nearly $38,000. While I realize that investing $12,000 per year in the portfolio can be challenging depending on one's circumstances, I still think this is a great example of the difference a multi-decade commitment and long-term mindset can make. The resulting yields on cost are shown in Figure 20. As a side note, the lower yields than in Scenario 1 are due to the fact that I have calculated them based on the capital invested over the entire period.
Figure 20: Hypothetical yields on cost for CME, RTX, RHHBY, KO, and PG stock after 30 years of dividend reinvestments and $200 monthly contribution to each stock (own work)
Evidently, the fruits of the dividend investment strategy are difficult for a new investor to recognize. It is human nature to think linearly and it can be difficult to understand the beneficial effects of compound interest. Dividend growth is not a get-rich-quick strategy and it requires commitment and a long-term mindset. Therefore, I think it's worth making a New Year's resolution to help maintain that mindset.
I wish all my readers and followers a happy, healthy and prosperous new year - thank you very much for reading my latest article. Whether you agree or disagree with my conclusions, I always welcome your opinion and feedback in the comments below. And if there's anything I should improve or expand on in future articles, drop me a line as well. As always, please consider this article only as a first step in your own due diligence.
For further details see:
Your New Year's Resolution For 2024: Invest $10,000 In These 5 Stocks